Create Pie plot.
ggpie(
  data,
  group_key = NULL,
  count_type = c("count", "full"),
  fill_color = NULL,
  label_info = "count",
  label_split = "[[:space:]]+",
  label_len = 40,
  label_color = "black",
  label_type = c("circle", "horizon", "none"),
  label_pos = c("in", "out"),
  label_gap = 0.05,
  label_threshold = NULL,
  label_size = 4,
  border_color = "black",
  border_size = 1,
  nudge_x = 1,
  nudge_y = 1
)
Arguments
| data | Data frame contains full data or summarized data. |
|---|---|
| group_key | Column used to summarize the data. Default: NULL. |
| count_type | Data frame type, chosen from "count" and "full". "count" means summarized data and "full" means full data. Default: count. |
| fill_color | Colors used. Default: NULL (conduct automatic selection). |
| label_info | Label information type, combine from group, count, ratio. For example, use "count" , "ratio" will show count and ratio, count is main label info, ratio is in brackets. Default: count. |
| label_split | Pattern used to split the label, support regular expression. Default: space. |
| label_len | The length of label text. Used when |
| label_color | Color of the label. Default: black. |
| label_type | Label style, chosen from circle, horizon and none (no label). Default: circle. |
| label_pos | Label position, chosen from in and out. Default: in. |
| label_gap | Gap between label and pie plot, used when |
| label_threshold | Threshold of the ratio to determine label position (in/out pie). Default: NULL. |
| label_size | Size of the label. Default: 4. |
| border_color | Border color. Default: black. |
| border_size | Border thickness. Default: 1. |
| nudge_x | Parameter of |
| nudge_y | Parameter of |
Value
A ggplot2 object.
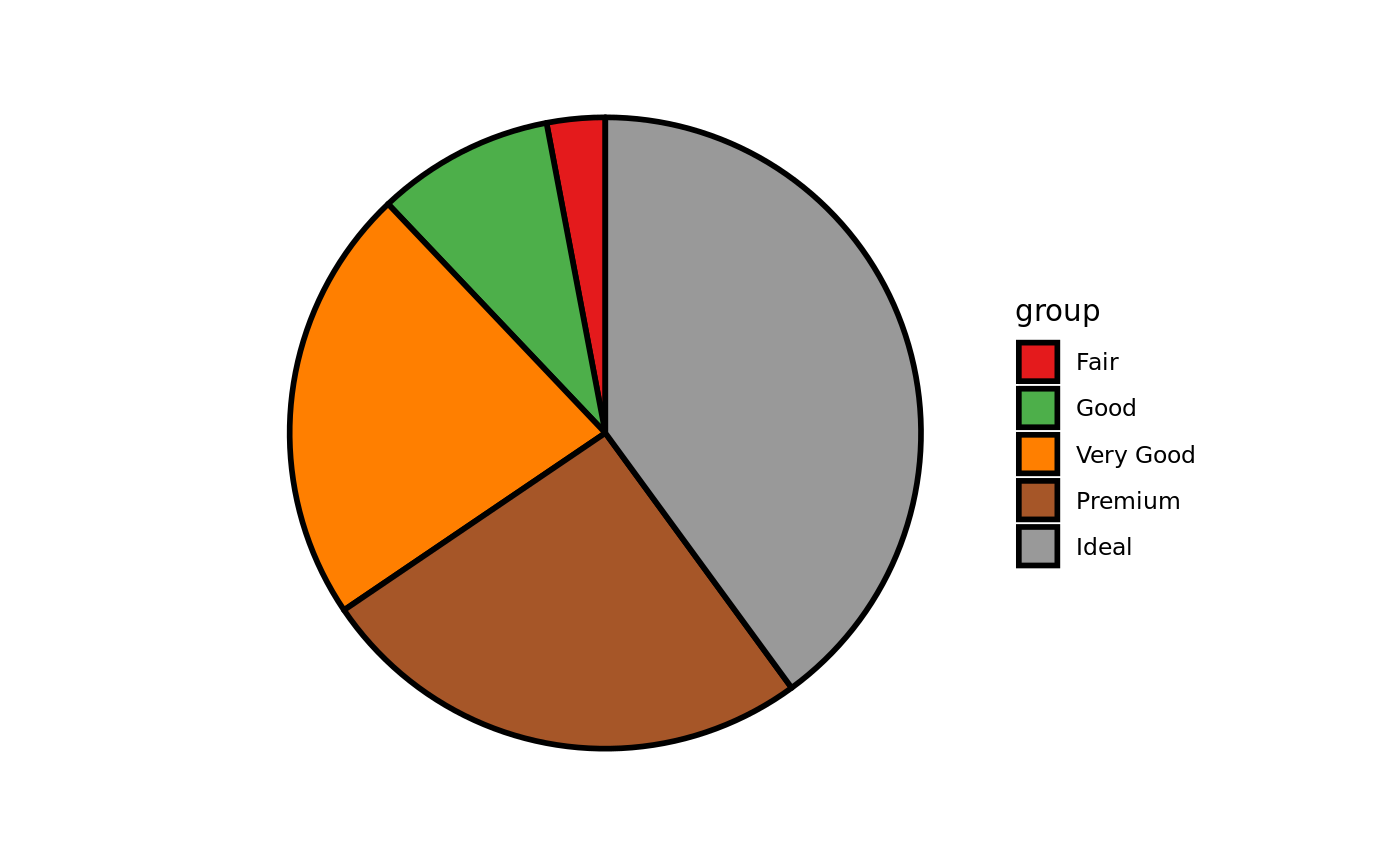
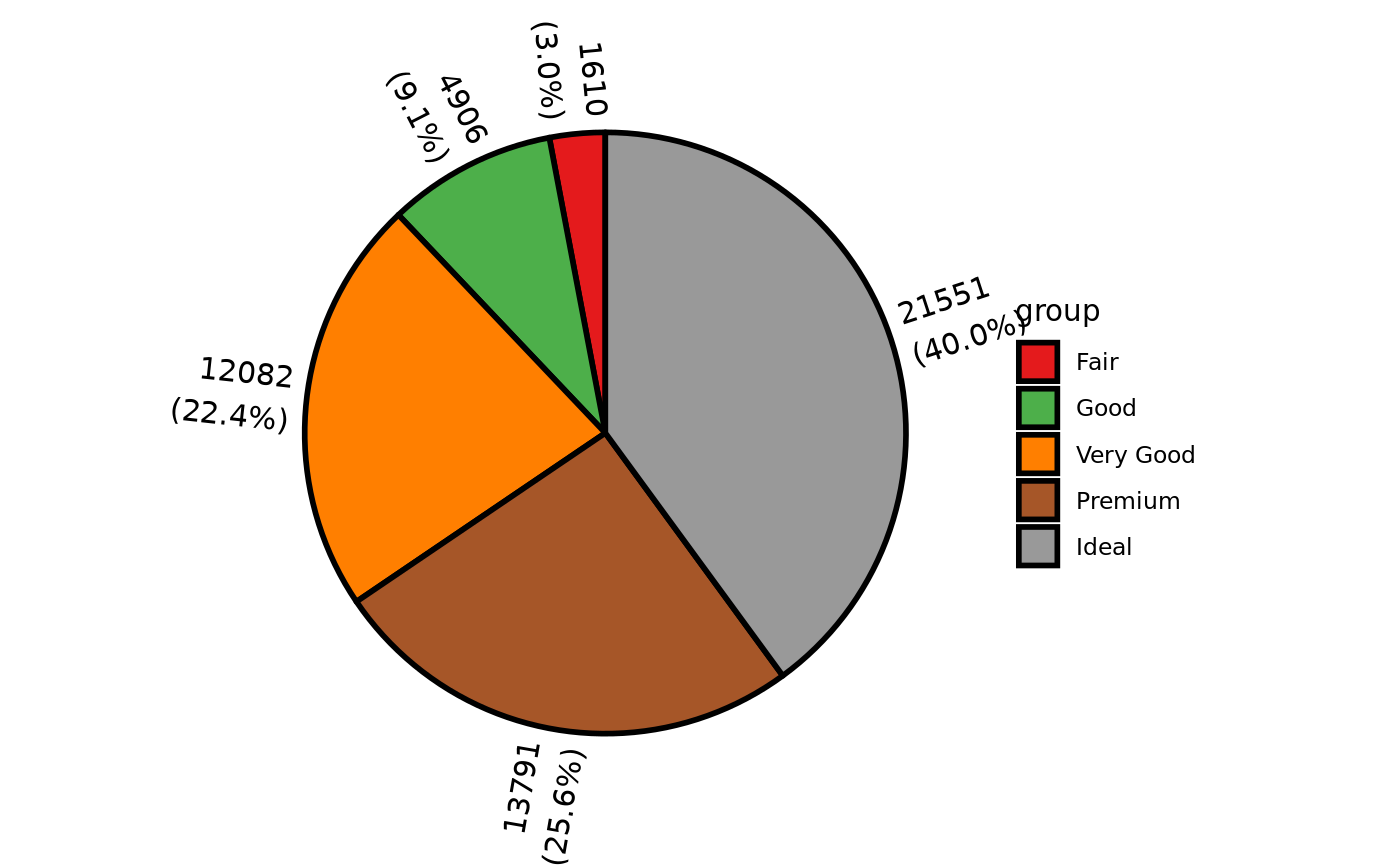
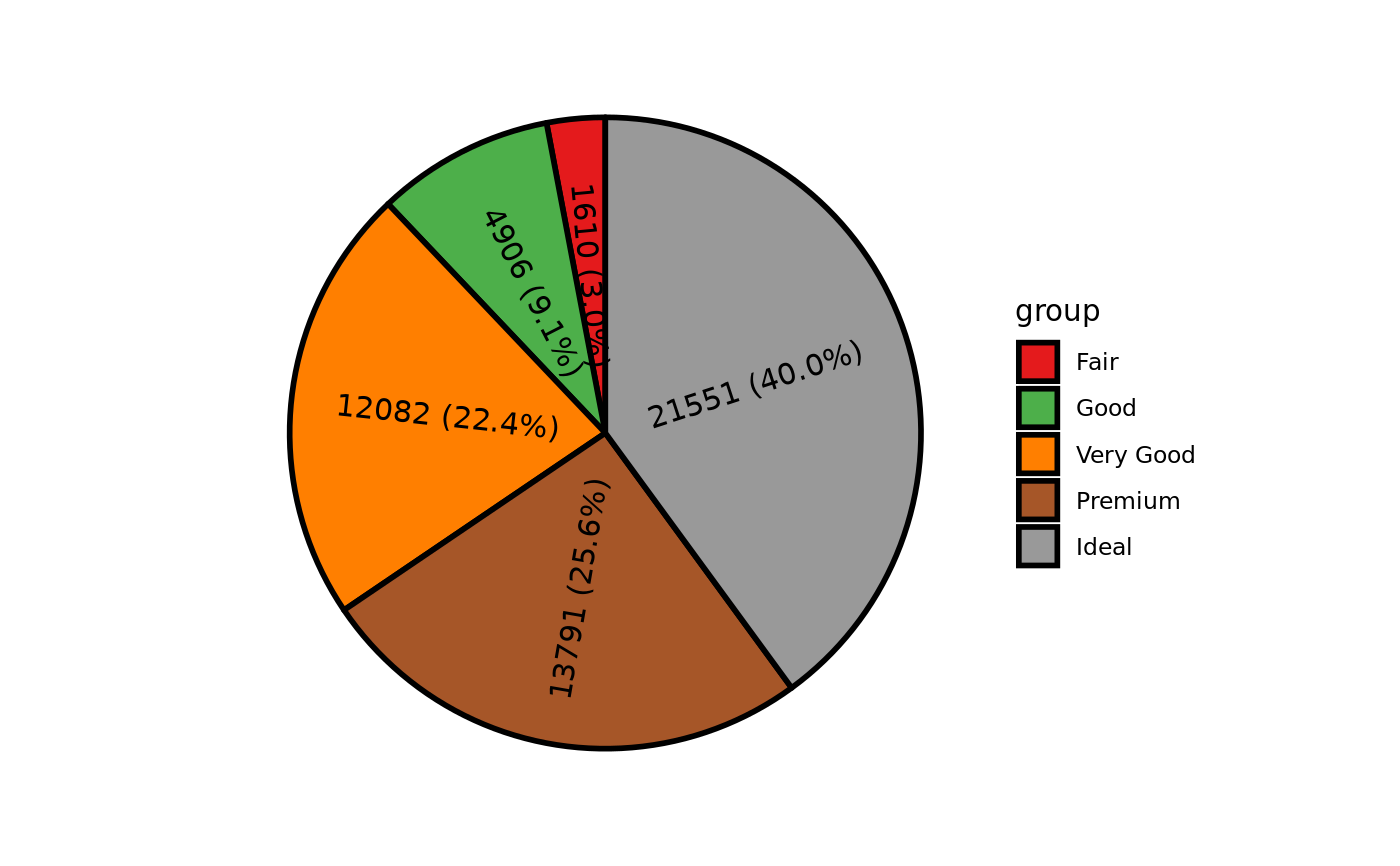
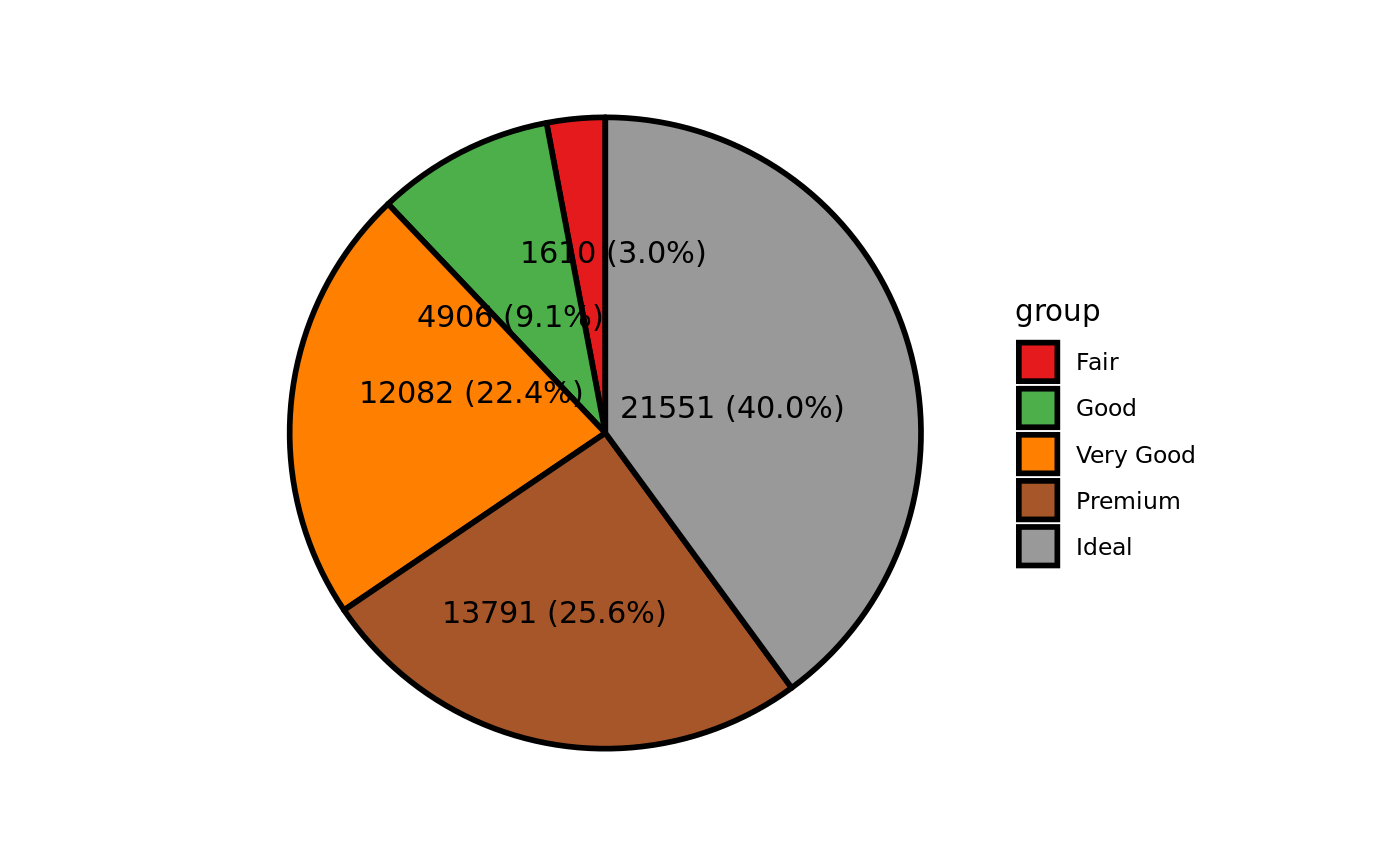
Examples
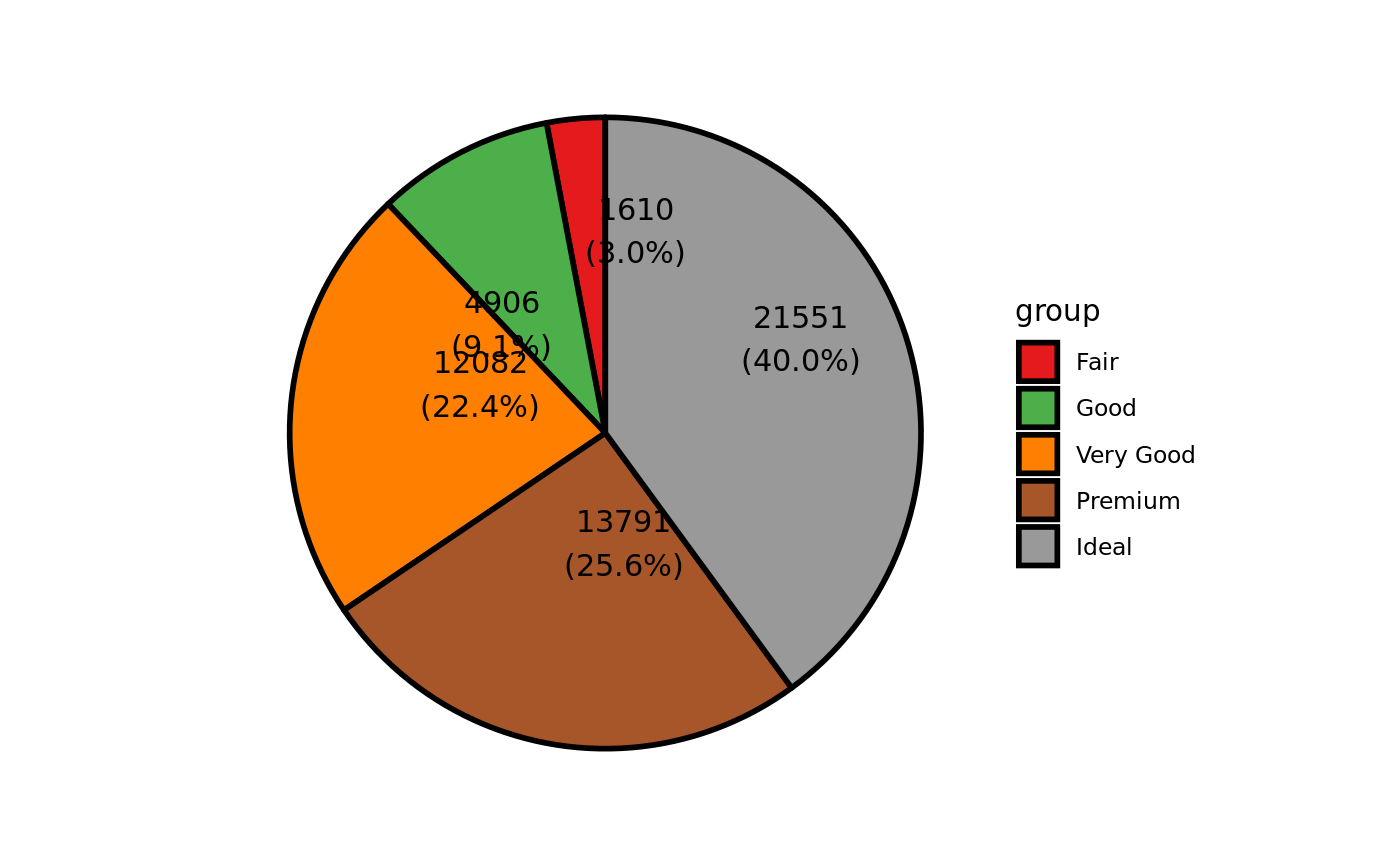
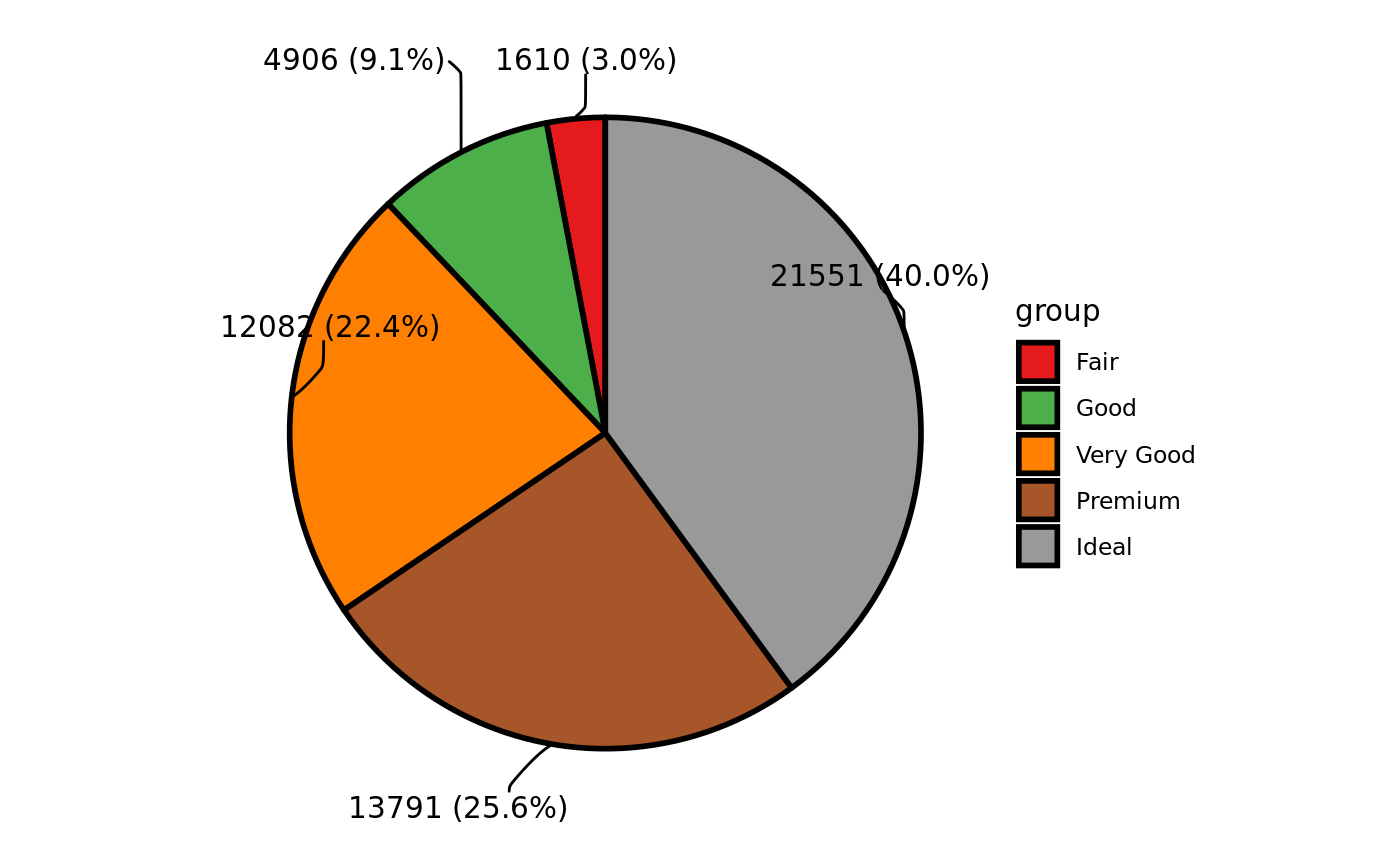
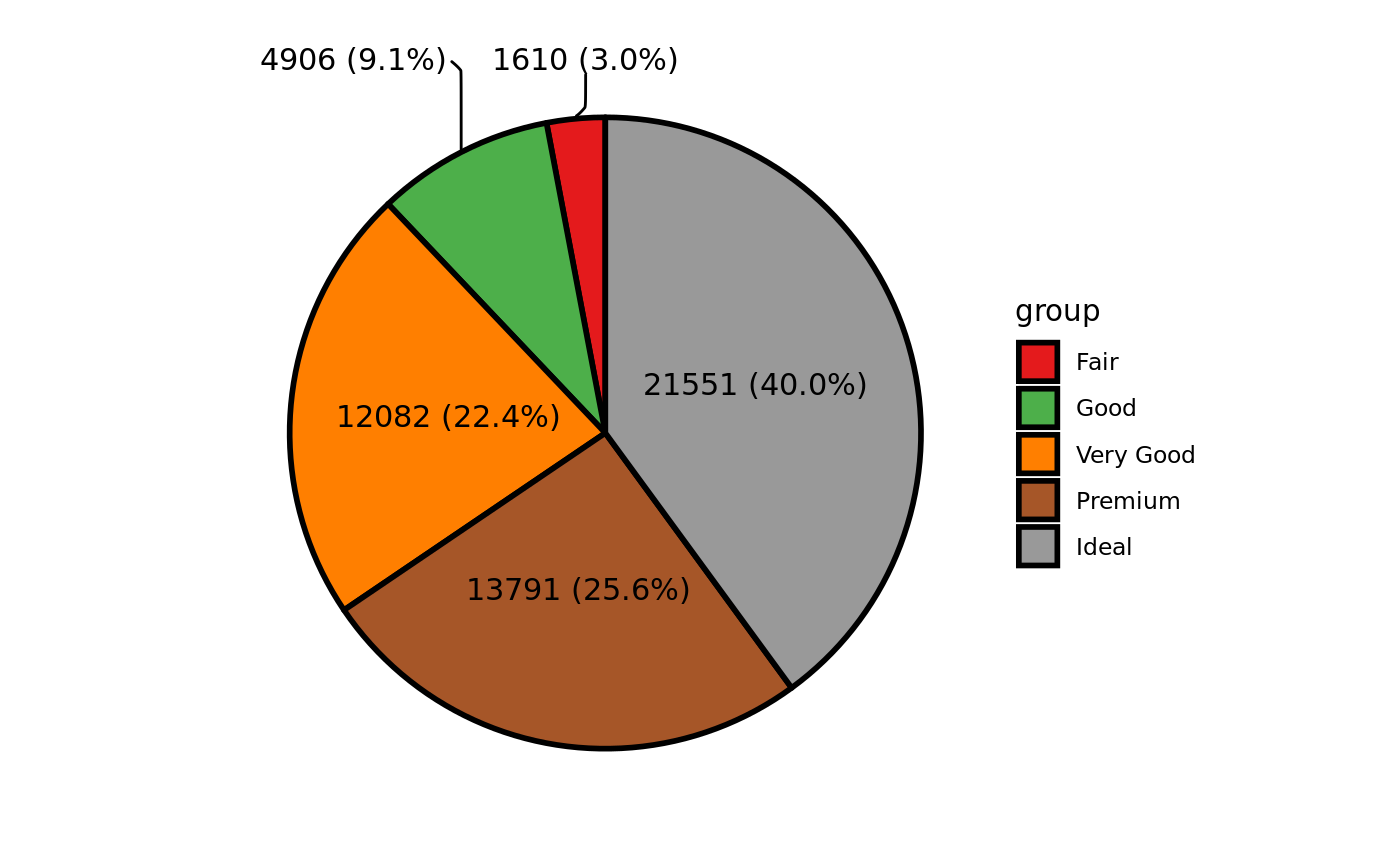
library(ggpie)
library(ggplot2)
data(diamonds)
# with no label
ggpie(
  data = diamonds, group_key = "cut", count_type = "full",
  label_info = c("count", "ratio"), label_type = "none"
)# circle label and out of pie
ggpie(
  data = diamonds, group_key = "cut", count_type = "full",
  label_info = c("count", "ratio"), label_type = "circle",
  label_size = 4, label_pos = "out"
)# circle label and in pie plot, with no split
ggpie(
  data = diamonds, group_key = "cut", count_type = "full",
  label_info = c("count", "ratio"), label_type = "circle", label_split = NULL,
  label_size = 4, label_pos = "in"
)# horizon label and in pie plot, with no split
ggpie(
  data = diamonds, group_key = "cut", count_type = "full",
  label_info = c("count", "ratio"), label_type = "horizon", label_split = NULL,
  label_size = 4, label_pos = "in"
)# horizon label and in pie plot, split with space
ggpie(
  data = diamonds, group_key = "cut", count_type = "full",
  label_info = c("count", "ratio"), label_type = "horizon",
  label_size = 4, label_pos = "in"
)# horizon label and out pie plot, with no split
ggpie(
  data = diamonds, group_key = "cut", count_type = "full",
  label_info = c("count", "ratio"), label_type = "horizon", label_split = NULL,
  label_size = 4, label_pos = "out"
)# with label threshold
ggpie(
  data = diamonds, group_key = "cut", count_type = "full",
  label_info = c("count", "ratio"), label_type = "horizon", label_split = NULL,
  label_size = 4, label_pos = "in", label_threshold = 10
)