Sample data
The sample data is from ggplot2:
# load sample data
library(ggplot2)
## Warning: replacing previous import 'lifecycle::last_warnings' by
## 'rlang::last_warnings' when loading 'tibble'
## Warning: replacing previous import 'lifecycle::last_warnings' by
## 'rlang::last_warnings' when loading 'pillar'## tibble[,10] [53,940 × 10] (S3: tbl_df/tbl/data.frame)
## $ carat : num [1:53940] 0.23 0.21 0.23 0.29 0.31 0.24 0.24 0.26 0.22 0.23 ...
## $ cut : Ord.factor w/ 5 levels "Fair"<"Good"<..: 5 4 2 4 2 3 3 3 1 3 ...
## $ color : Ord.factor w/ 7 levels "D"<"E"<"F"<"G"<..: 2 2 2 6 7 7 6 5 2 5 ...
## $ clarity: Ord.factor w/ 8 levels "I1"<"SI2"<"SI1"<..: 2 3 5 4 2 6 7 3 4 5 ...
## $ depth : num [1:53940] 61.5 59.8 56.9 62.4 63.3 62.8 62.3 61.9 65.1 59.4 ...
## $ table : num [1:53940] 55 61 65 58 58 57 57 55 61 61 ...
## $ price : int [1:53940] 326 326 327 334 335 336 336 337 337 338 ...
## $ x : num [1:53940] 3.95 3.89 4.05 4.2 4.34 3.94 3.95 4.07 3.87 4 ...
## $ y : num [1:53940] 3.98 3.84 4.07 4.23 4.35 3.96 3.98 4.11 3.78 4.05 ...
## $ z : num [1:53940] 2.43 2.31 2.31 2.63 2.75 2.48 2.47 2.53 2.49 2.39 ...ggpie
Introduction
ggpie aims to create pie (2D and 3D), donut and rose pie plot with the ggplot2 plotting system which implemented the grammar of graphics. It contains five main functions:
-
ggpie: Create 2D pie plot with single group variable. -
ggdonut: Create 2D donut plot with single group variable. -
ggnestedpie: Create 2D nested pie plot with two group variables. -
ggpie3D: Create 3D pie plot with single group variable. -
ggrosepie: Create rose pie plot with single or two group variables.
One of the advantages of ggpie is the optimization of the label, it supports two main label styles (horizontal and circle) and three label positions (in, out and mix).
Installation
You can install the released version of ggpie from CRAN with:
install.packages("ggpie")
Or install the package via the Github repository:
# install.package("remotes")   #In case you have not installed it.
remotes::install_github("showteeth/ggpie")
Load ggpie:
library(ggpie)
2D pie chart
horizontal label
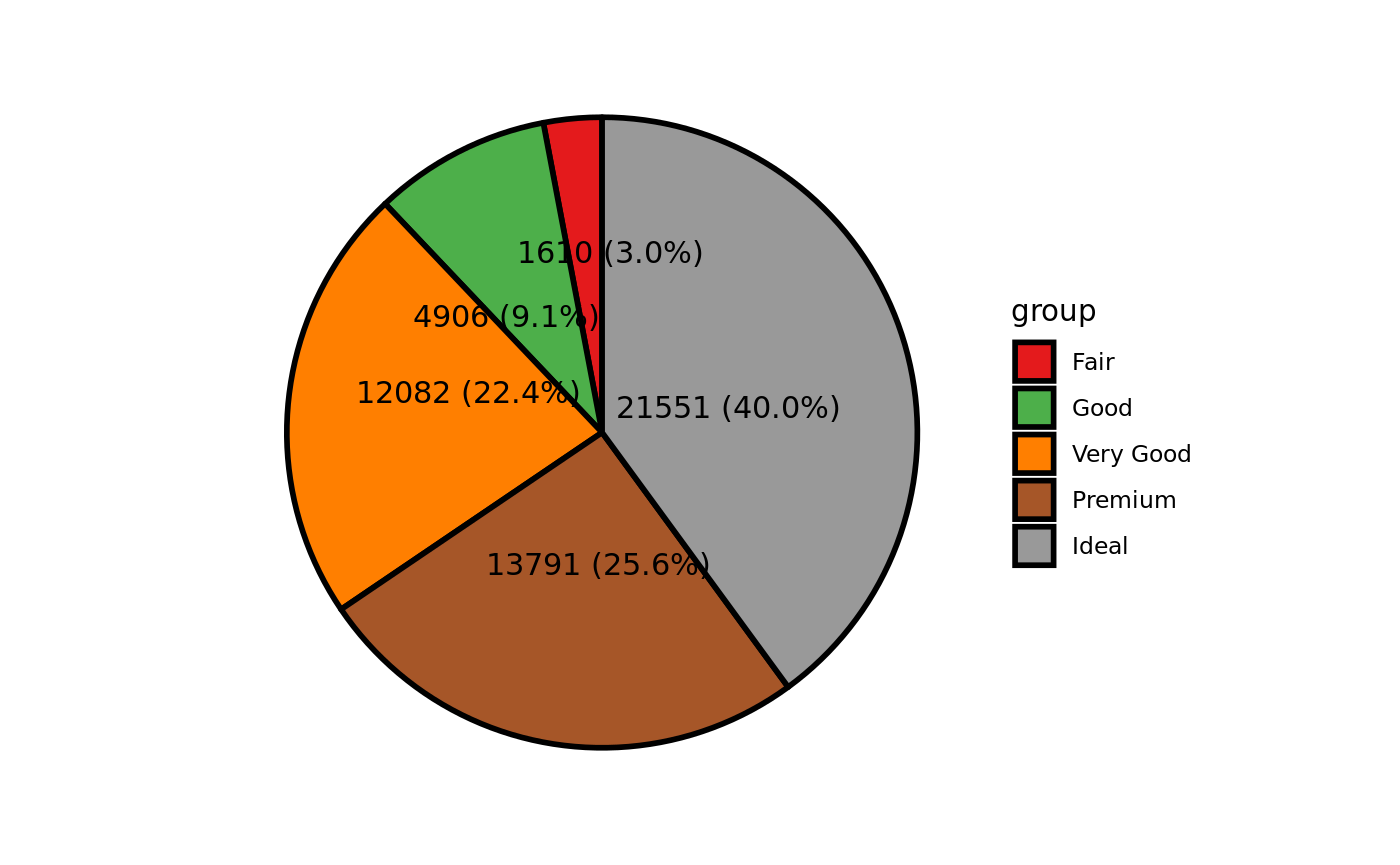
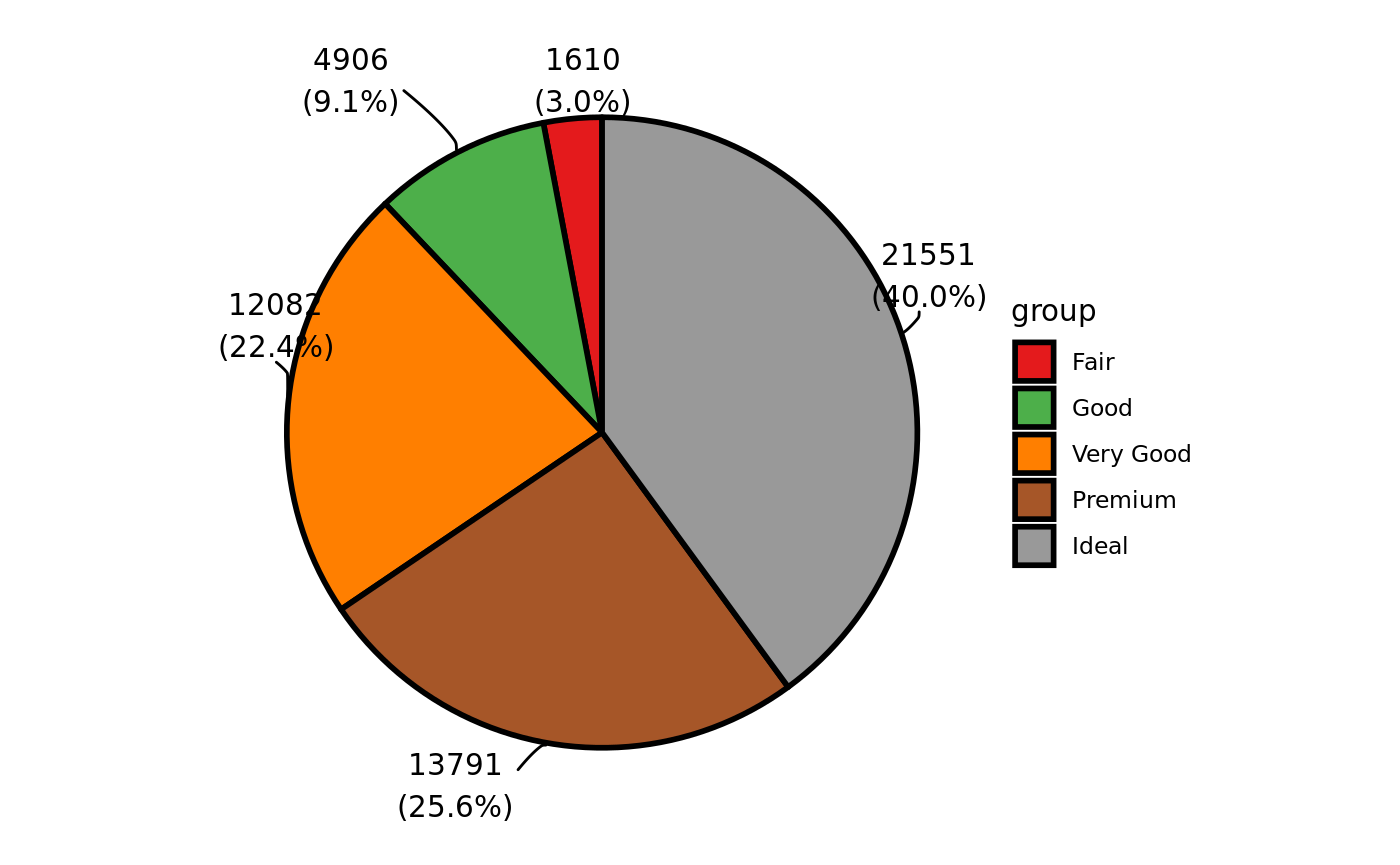
Create a pie plot with label in the pie:
ggpie(data = diamonds, group_key = "cut", count_type = "full",
      label_info = c("count", "ratio"), label_type = "horizon", label_split = NULL,
      label_size = 4, label_pos = "in")
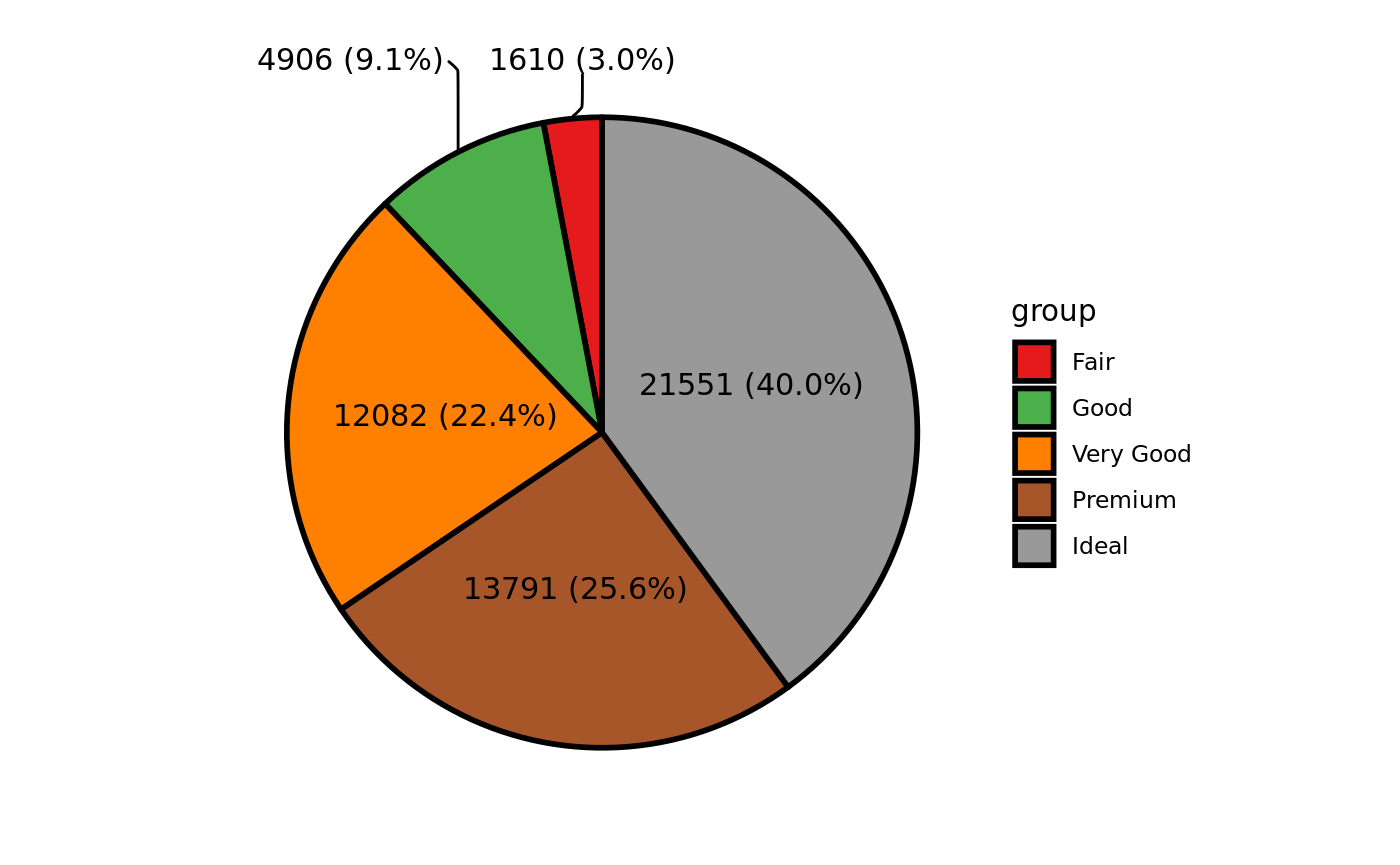
Create a pie plot with label out of the pie:
ggpie(data = diamonds, group_key = "cut", count_type = "full",
      label_info = c("count", "ratio"), label_type = "horizon",
      label_size = 4, label_pos = "out" )

Create a pie plot with mixture label:
ggpie(data = diamonds, group_key = "cut", count_type = "full",
      label_info = c("count", "ratio"), label_type = "horizon", label_split = NULL,
      label_size = 4, label_pos = "in", label_threshold = 10)
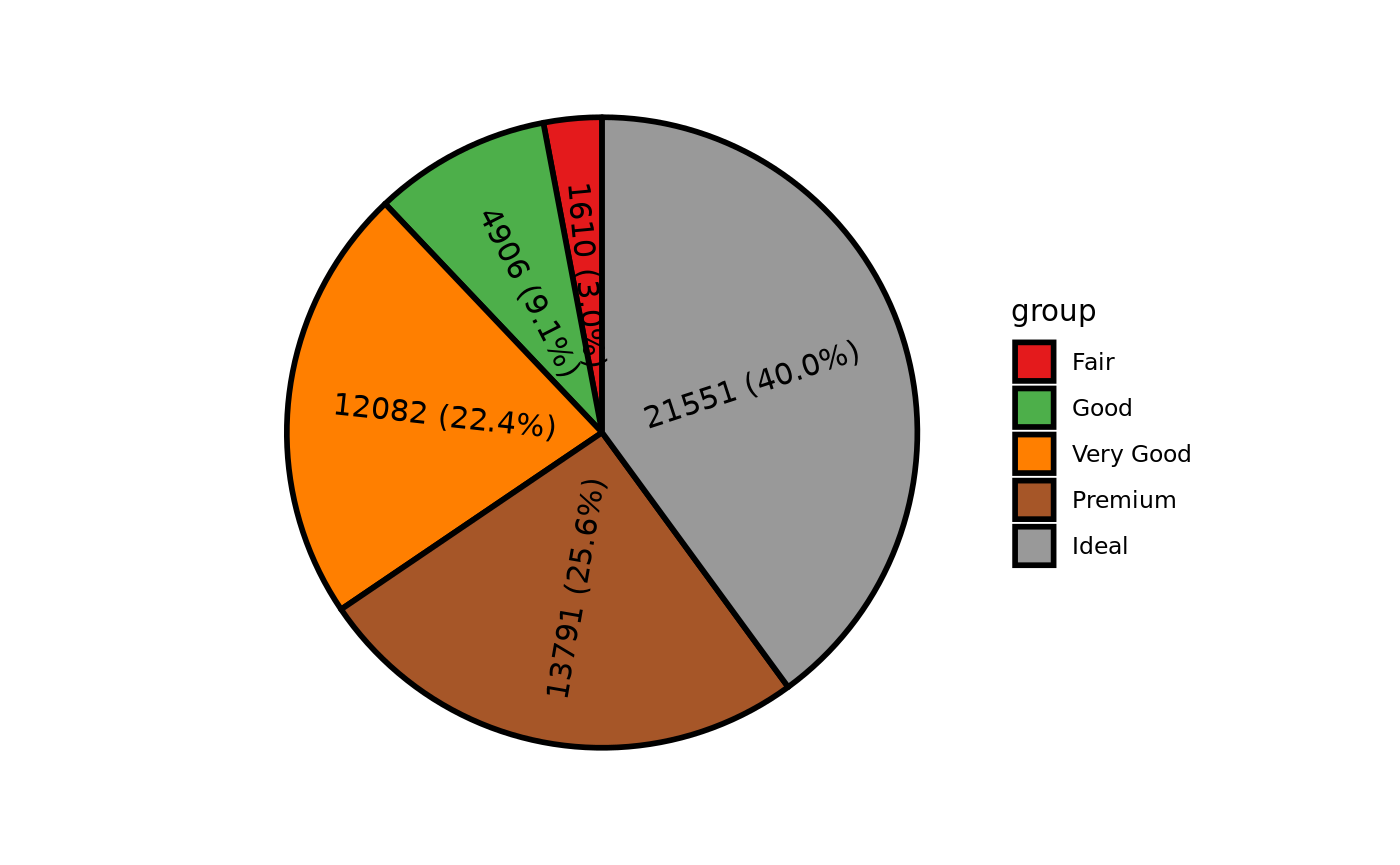
circle label
Create a pie plot with label in the pie:
ggpie(data = diamonds, group_key = "cut", count_type = "full",
      label_info = c("count", "ratio"), label_type = "circle", label_split = NULL,
      label_size = 4, label_pos = "in")
Create a pie plot with label out of the pie:
ggpie(data = diamonds, group_key = "cut", count_type = "full",
      label_info = c("count", "ratio"), label_type = "circle",label_split = NULL,
      label_size = 4, label_pos = "out")
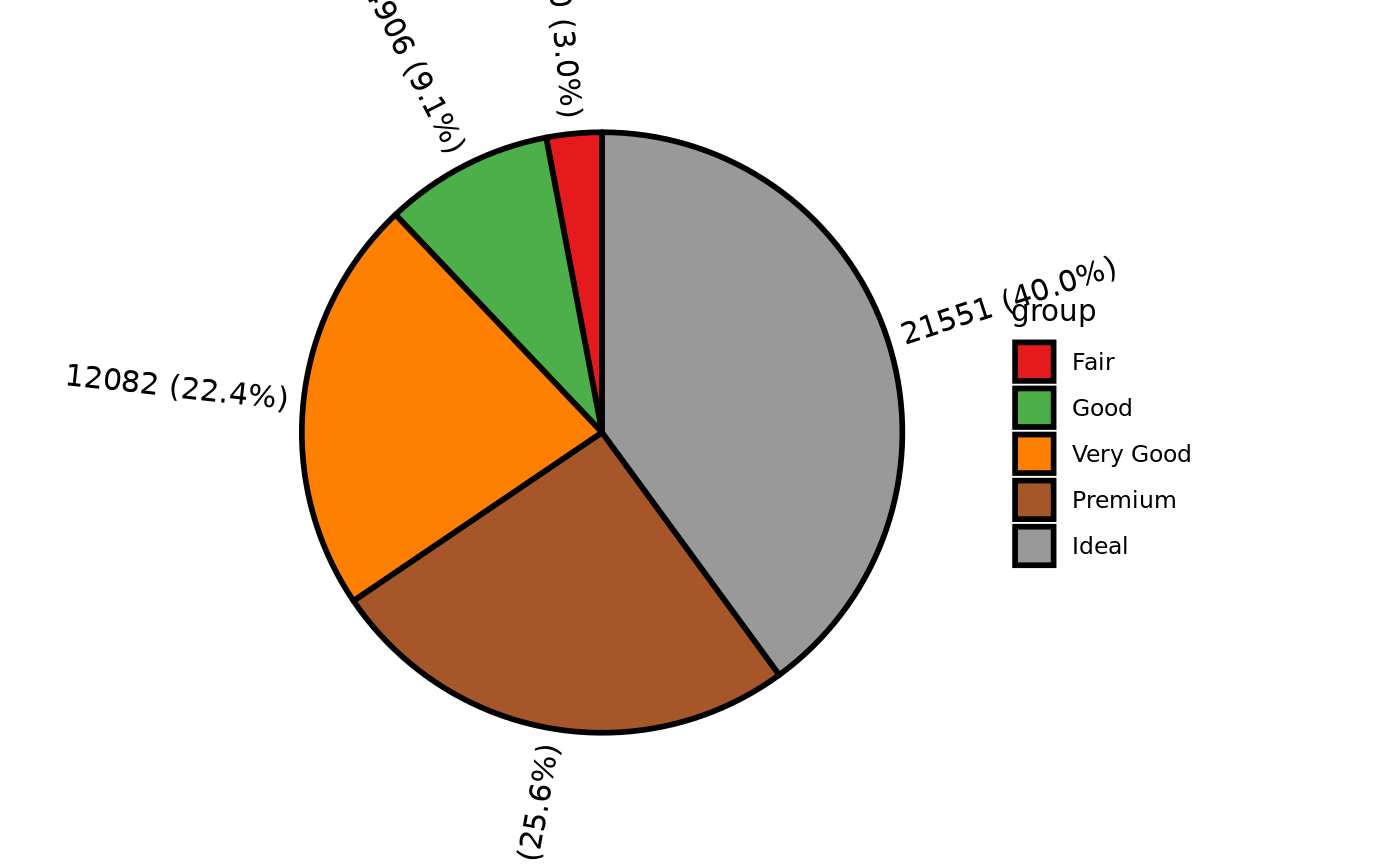
Please notice that, create a pie plot with circle label does not support mixture label.
split label
Besides adding horizontal and circle labels, ggpie also support split the label with regex. By default, ggpie will split the label by spaces ([[:space:]]+):
ggpie(data = diamonds, group_key = "cut", count_type = "full",
      label_info = c("count", "ratio"), label_type = "horizon", label_split = "[[:space:]]+",
      label_size = 4, label_pos = "out" )
Please notice that, spliting the label is support by all available tools in ggpie (ggpie, ggdonut, ggnestedpie, ggpie3D, ggrosepie).
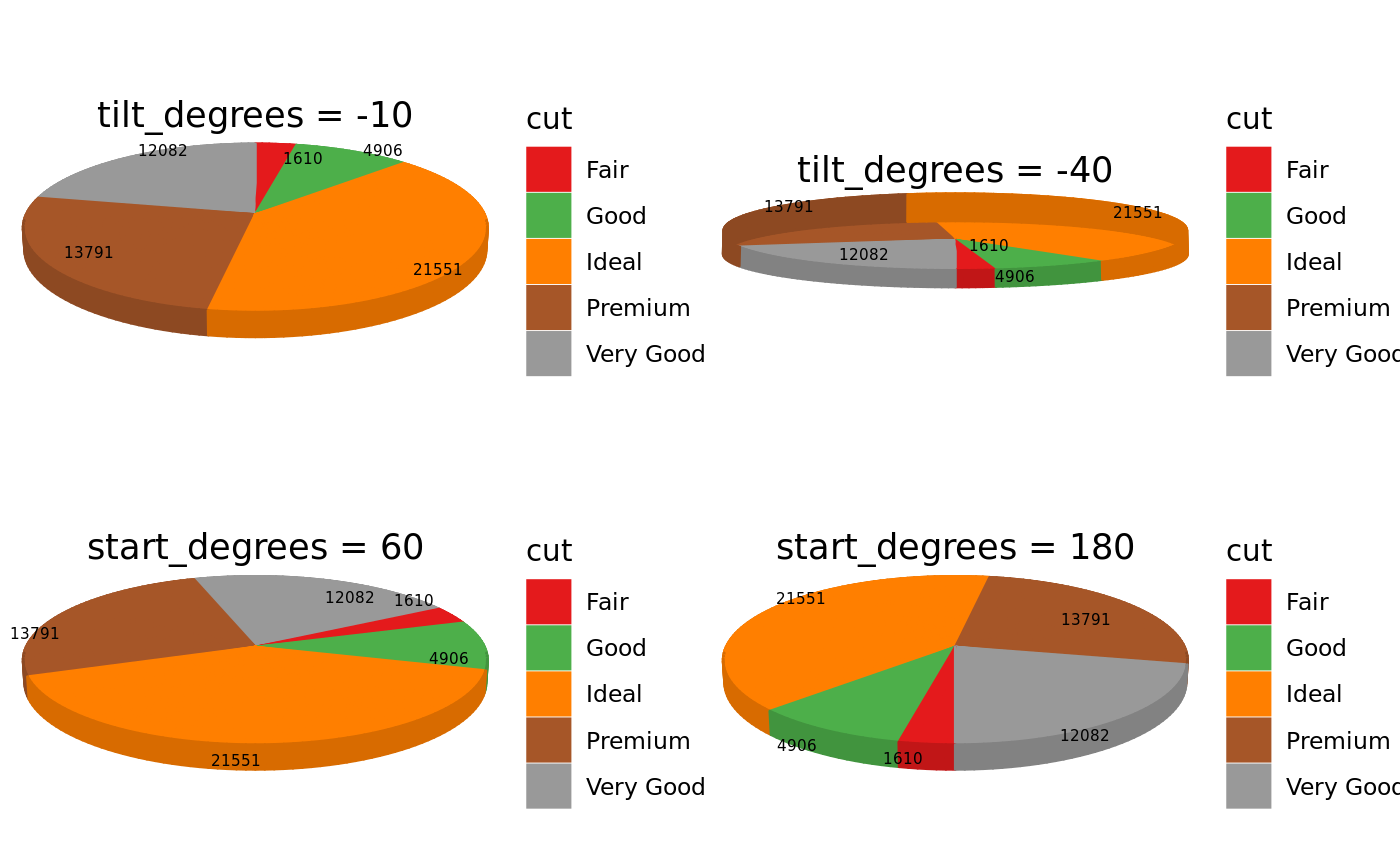
3D pie chart
3D pie chart is adopted and modified from ggthreed:
p1= ggpie3D(data = diamonds, group_key = "cut", count_type = "full", tilt_degrees = -10, label_size=2) +
  ggtitle("tilt_degrees = -10") +
  theme(plot.title = element_text(hjust = 0.5))

p2= ggpie3D(data = diamonds, group_key = "cut", count_type = "full", tilt_degrees = -40, label_size=2) +
  ggtitle("tilt_degrees = -40") +
  theme(plot.title = element_text(hjust = 0.5))

p3= ggpie3D(data = diamonds, group_key = "cut", count_type = "full", tilt_degrees = -10,
            start_degrees = 60, label_size=2) +
  ggtitle("start_degrees = 60") +
  theme(plot.title = element_text(hjust = 0.5))

p4= ggpie3D(data = diamonds, group_key = "cut", count_type = "full", tilt_degrees = -10,
            start_degrees = 180, label_size=2) +
  ggtitle("start_degrees = 180") +
  theme(plot.title = element_text(hjust = 0.5))

cowplot::plot_grid(p1,p2,p3,p4,ncol = 2)
Donut plot
horizontal label
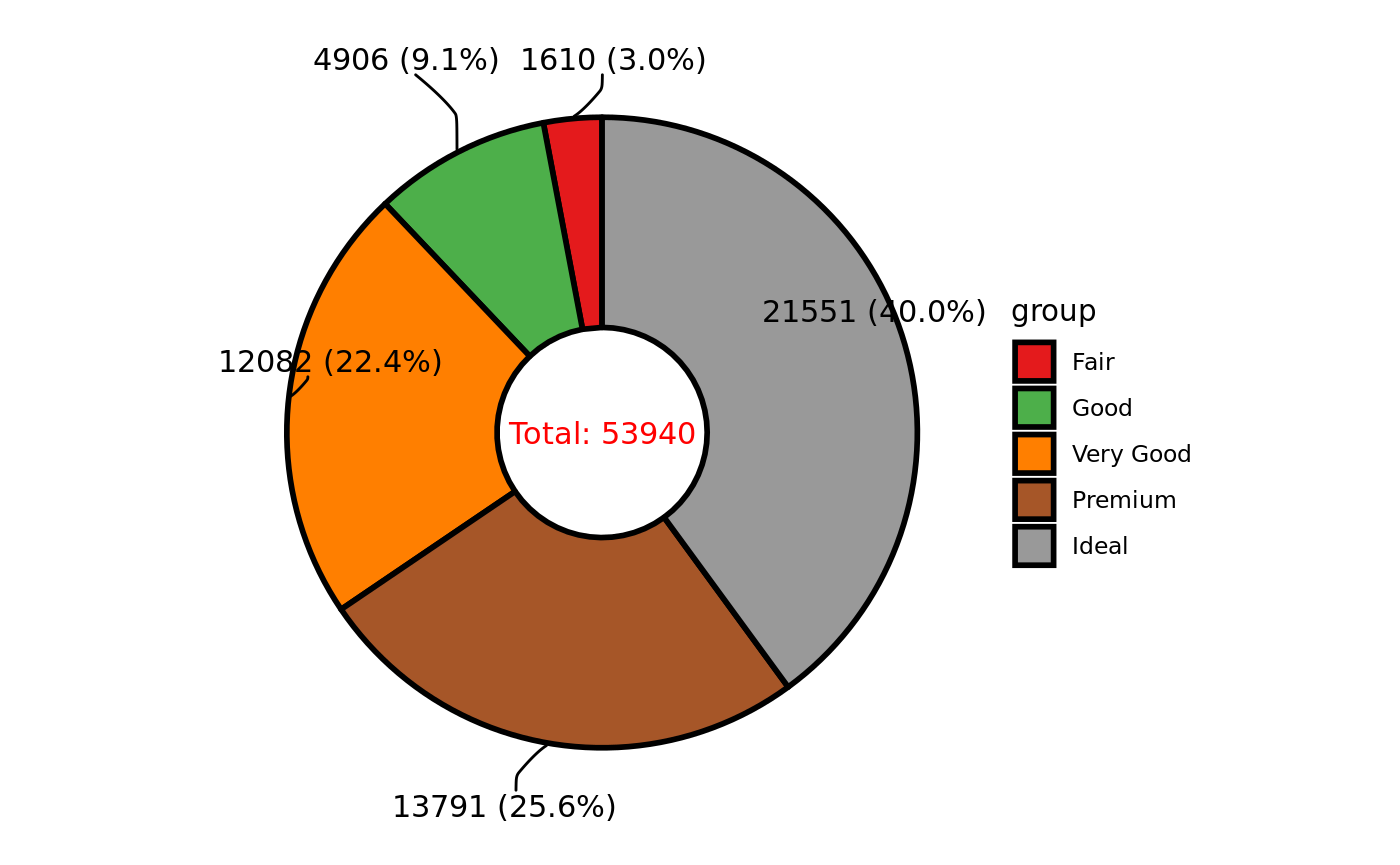
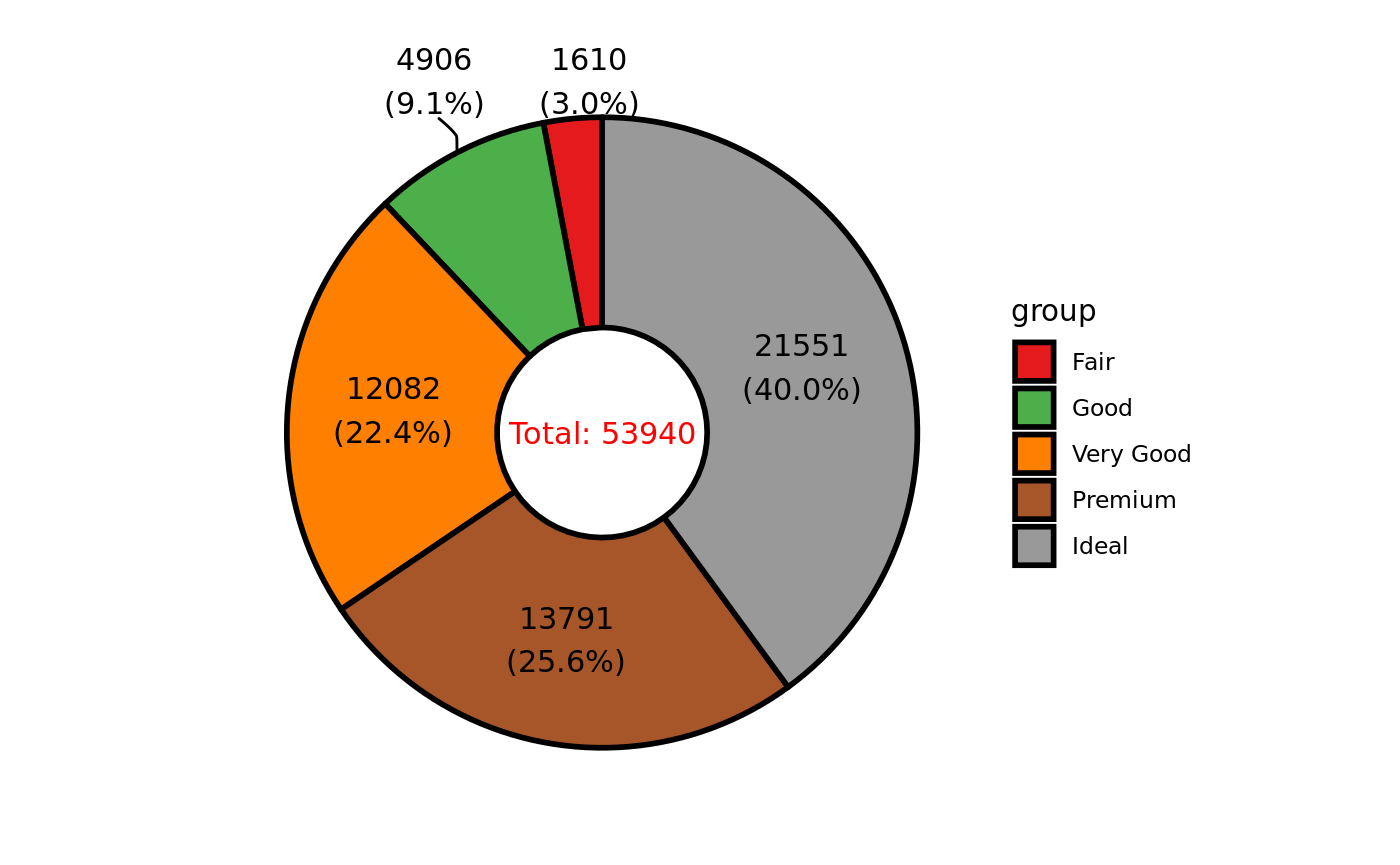
Create a donut plot with label in the pie:
ggdonut(data = diamonds, group_key = "cut", count_type = "full",
        label_info = c("count", "ratio"), label_type = "horizon", label_split = NULL,
        label_size = 4, label_pos = "in")
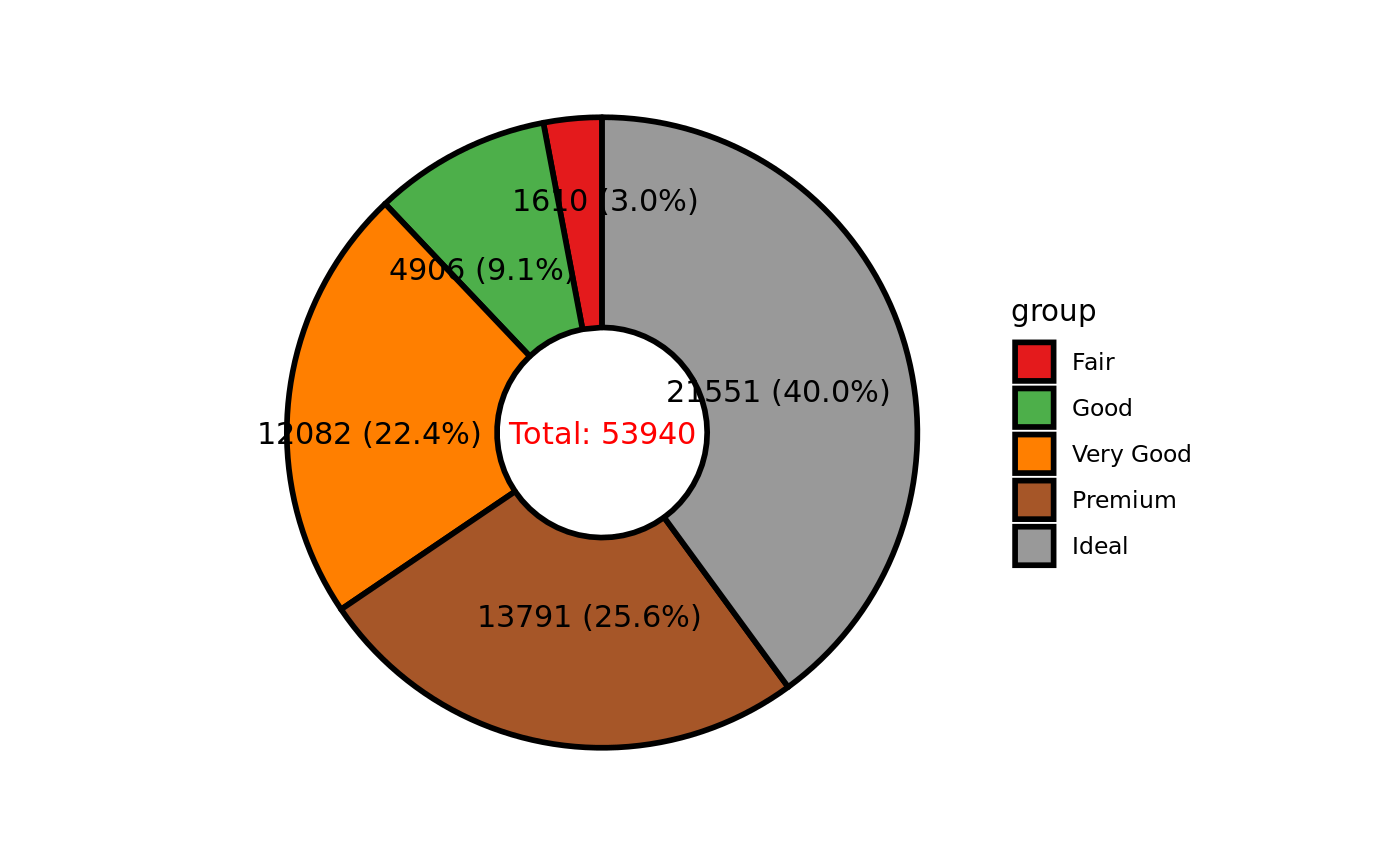
Create a donut plot with label out of the pie:
ggdonut(data = diamonds, group_key = "cut", count_type = "full",
        label_info = c("count", "ratio"), label_type = "horizon", label_split = NULL,
        label_size = 4, label_pos = "out")
Create a donut plot with mixture label:
ggdonut(data = diamonds, group_key = "cut", count_type = "full",
        label_info = c("count", "ratio"), label_type = "horizon",
        label_size = 4, label_pos = "in", label_threshold = 10)
circle label
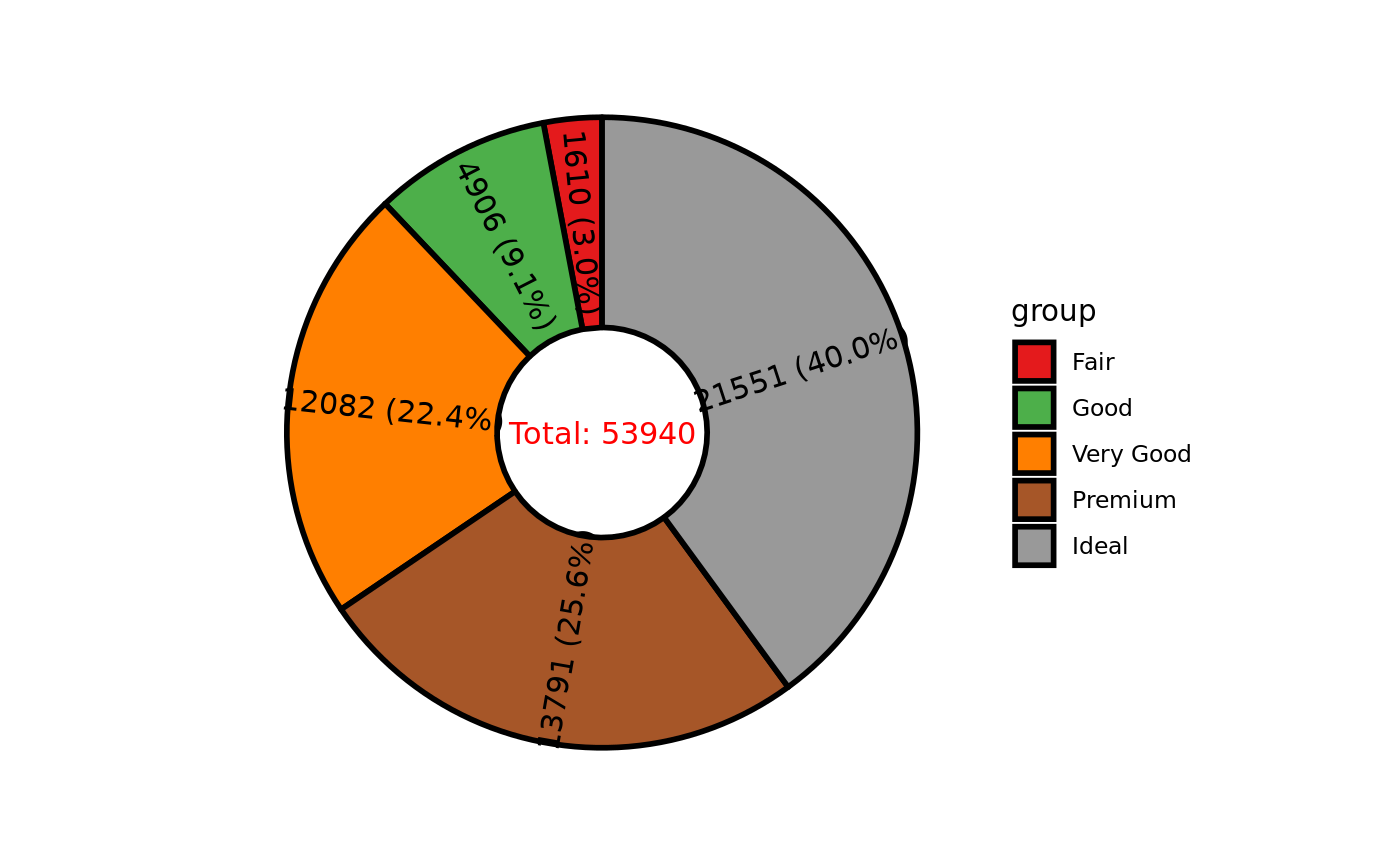
Create a donut plot with label in the pie:
ggdonut(data = diamonds, group_key = "cut", count_type = "full",
        label_info = c("count", "ratio"), label_type = "circle", label_split = NULL,
        label_size = 4, label_pos = "in")
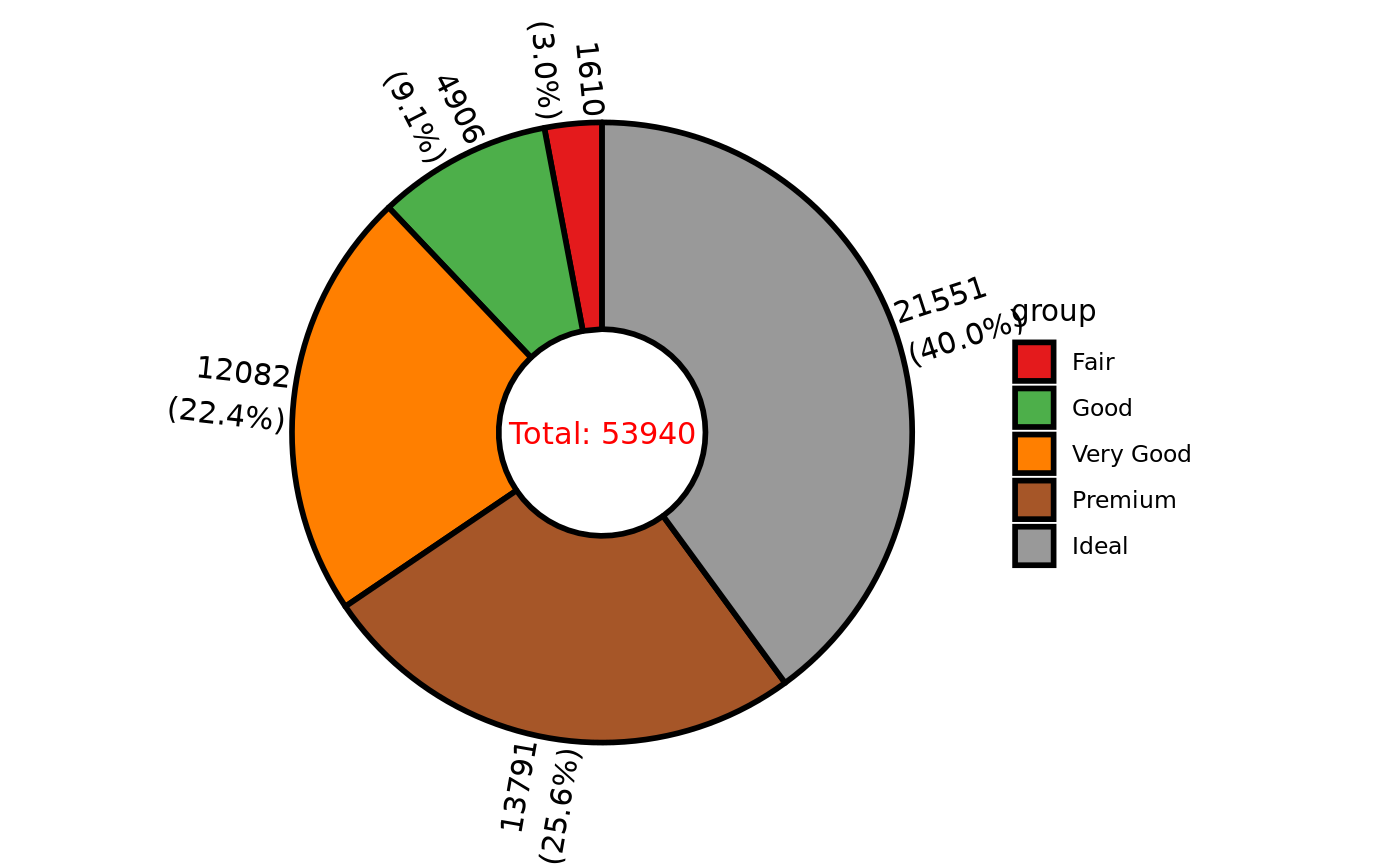
Create a donut plot with label out of the pie:
ggdonut(data = diamonds, group_key = "cut", count_type = "full",
        label_info = c("count", "ratio"), label_type = "circle",
        label_size = 4, label_pos = "out")
Nested pie/donut plot
It is often the case that we have two categorical variables and then need to plot for both of them, ggnestedpie is designed to deal with this.
inner and outer are circle labels
inner circle label and no split, outer circle label and in pie plot
ggnestedpie(data = diamonds, group_key = c("cut", "color"), count_type = "full",
            inner_label_info = "all", inner_label_split = NULL,inner_label_size = 2,
            outer_label_type = "circle", outer_label_pos = "in", outer_label_info = "all")
## Coordinate system already present. Adding new coordinate system, which will replace the existing one.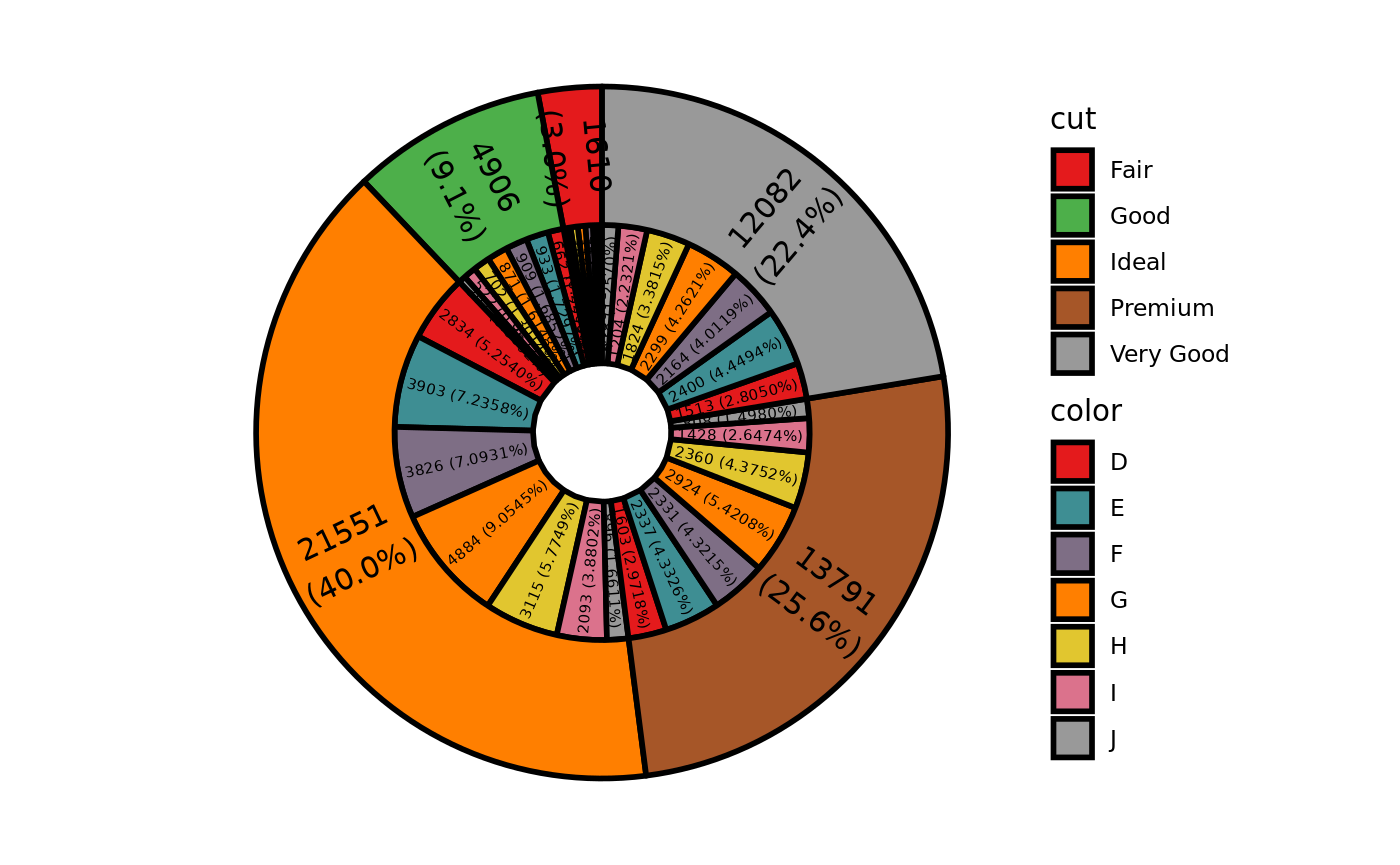
inner circle label and no split, outer circle label and in pie plot, remove fraction below 1 of inner pie:
ggnestedpie(data = diamonds, group_key = c("cut", "color"), count_type = "full",
            inner_label_info = "all", inner_label_split = NULL,
            inner_label_threshold = 5, inner_label_size = 2,
            outer_label_type = "circle", outer_label_pos = "in", outer_label_info = "all")
## Coordinate system already present. Adding new coordinate system, which will replace the existing one.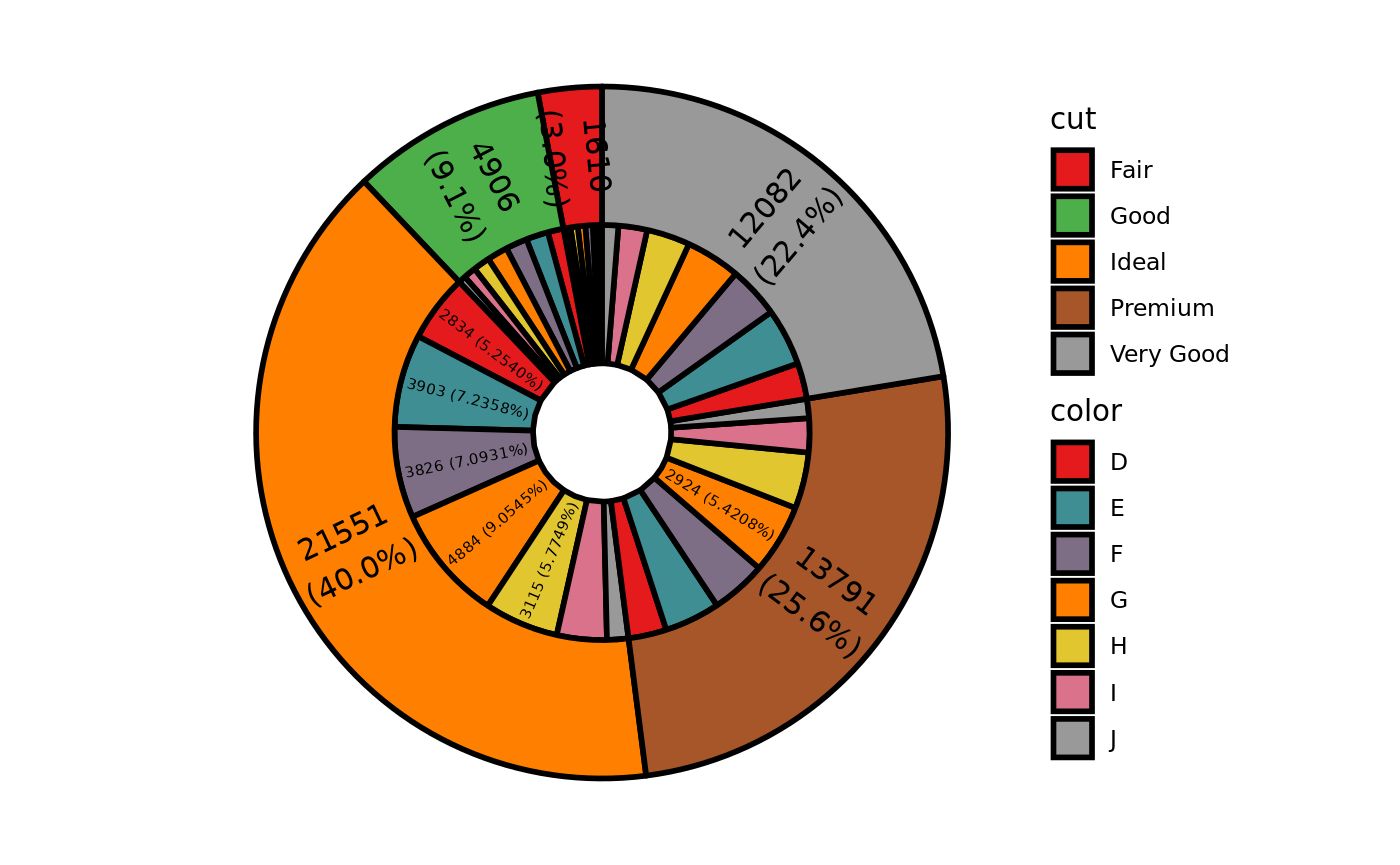
inner circle label and no split, outer circle label and out of pie plot:
ggnestedpie(data = diamonds, group_key = c("cut", "color"), count_type = "full",
            inner_label_info = "all", inner_label_split = NULL, inner_label_size = 2,
            outer_label_type = "circle", outer_label_pos = "out", outer_label_info = "all")
## Coordinate system already present. Adding new coordinate system, which will replace the existing one.
inner circle label and outer horizontal label
inner circle label and no split, outer horizontal label and out of pie plot, remove fraction below 1 of inner pie:
ggnestedpie(data = diamonds, group_key = c("cut", "color"), count_type = "full",
            inner_label_info = "all", inner_label_split = NULL,
            inner_label_threshold = 1, inner_label_size = 2,
            outer_label_type = "horizon", outer_label_pos = "out", outer_label_info = "all")
## Coordinate system already present. Adding new coordinate system, which will replace the existing one.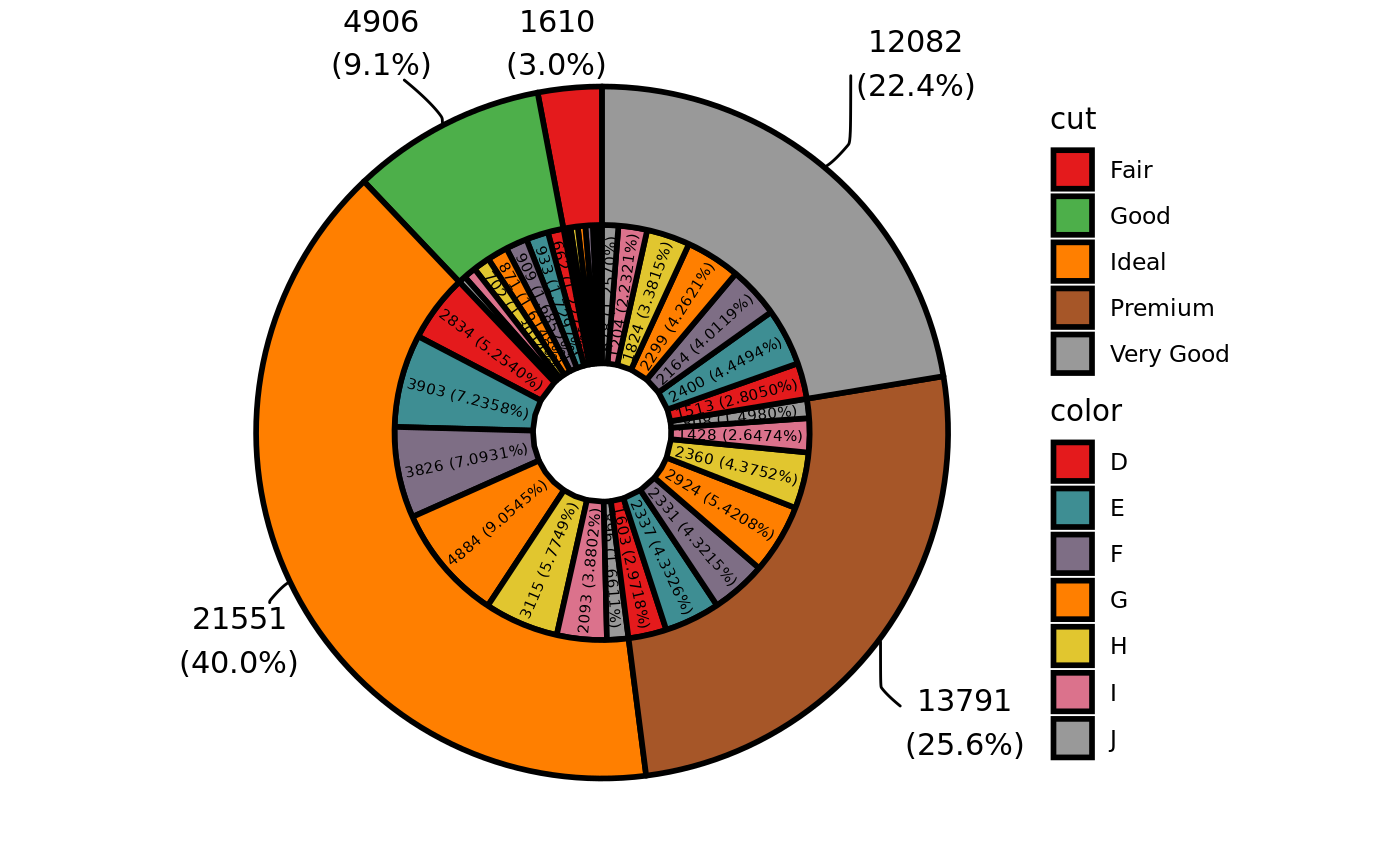
inner circle label and no split, outer horizontal label and in pie plot, remove fraction below 1 of inner pie, adjust fraction below 10 to out of pie of outer pie plot:
ggnestedpie(data = diamonds, group_key = c("cut", "color"), count_type = "full",
            inner_label_info = "all", inner_label_split = NULL,
            inner_label_threshold = 1, inner_label_size = 2,
            outer_label_type = "horizon", outer_label_pos = "in",
            outer_label_info = "all", outer_label_threshold = 10)
## Coordinate system already present. Adding new coordinate system, which will replace the existing one.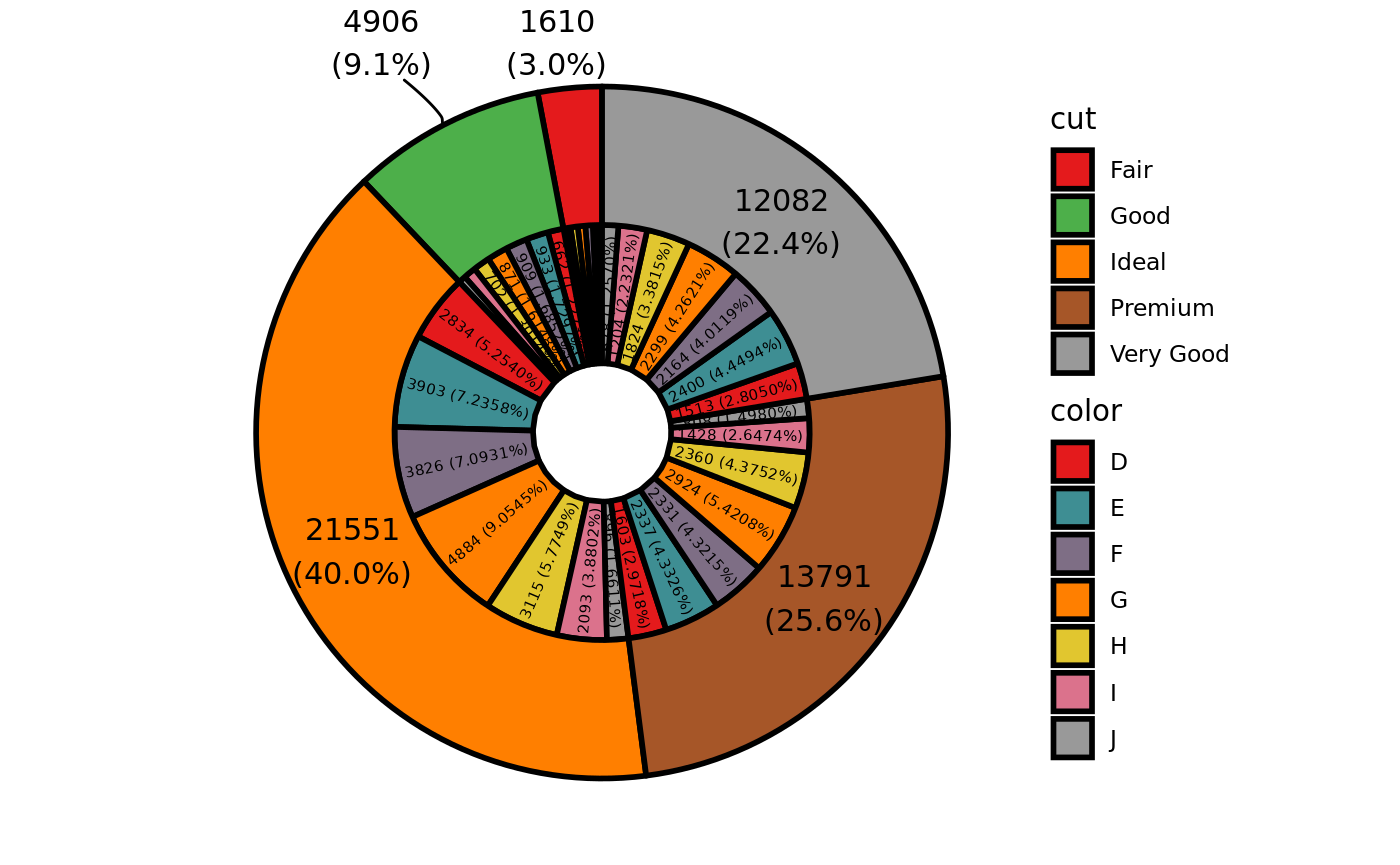
blank between plot
Add blank between inner and outer plot:
ggnestedpie(data = diamonds, group_key = c("cut", "color"), count_type = "full",
            r0 = 0.5, r1 = 1.5, r2 = 2.6,inner_label_info = "all", inner_label_split = NULL,
            inner_label_threshold = 1, inner_label_size = 2,
            outer_label_type = "horizon", outer_label_pos = "in",
            outer_label_info = "all", outer_label_threshold = 10)
## Coordinate system already present. Adding new coordinate system, which will replace the existing one.![]()
Rose pie/donut plot
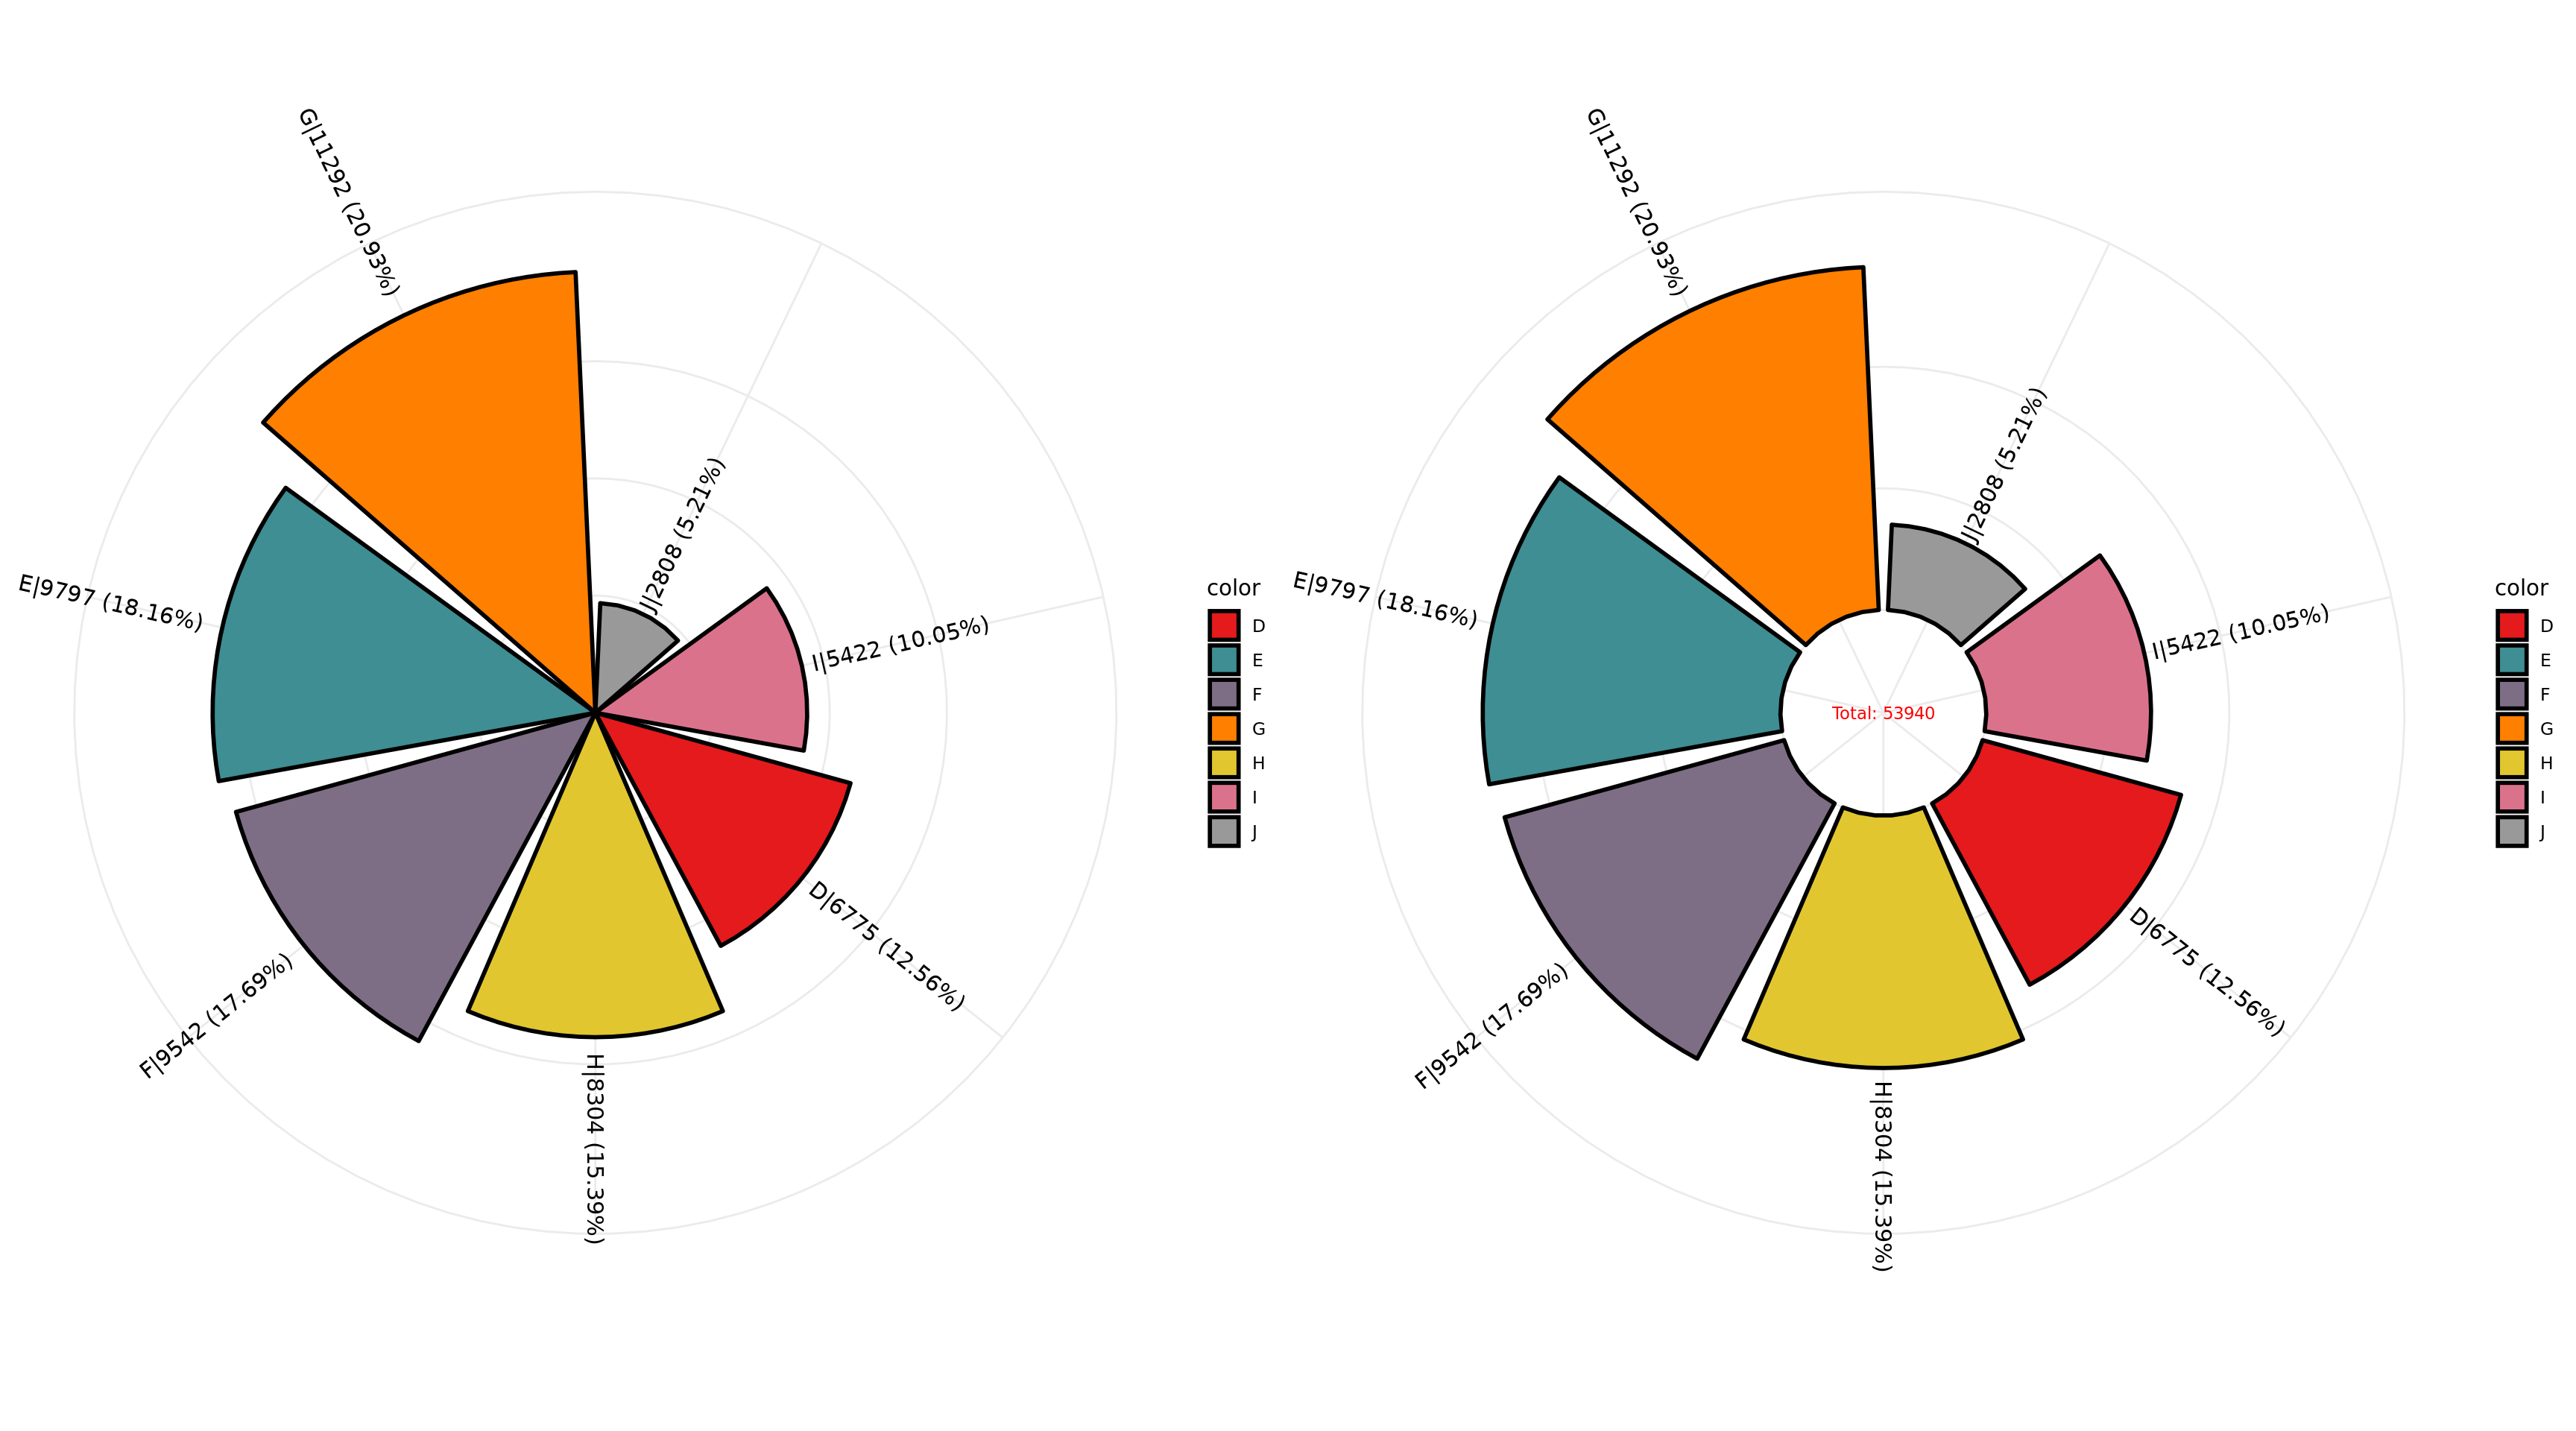
single variable
do not show tick:
# pie plot
p1=ggrosepie(diamonds, group_key = "color", count_type = "full", label_info = "all",
             show_tick=F,donut_frac=NULL)
# donut plot
p2=ggrosepie(diamonds, group_key = "color", count_type = "full", label_info = "all",
             show_tick=F,donut_frac=0.3,donut_label_size=3)
cowplot::plot_grid(p1,p2)
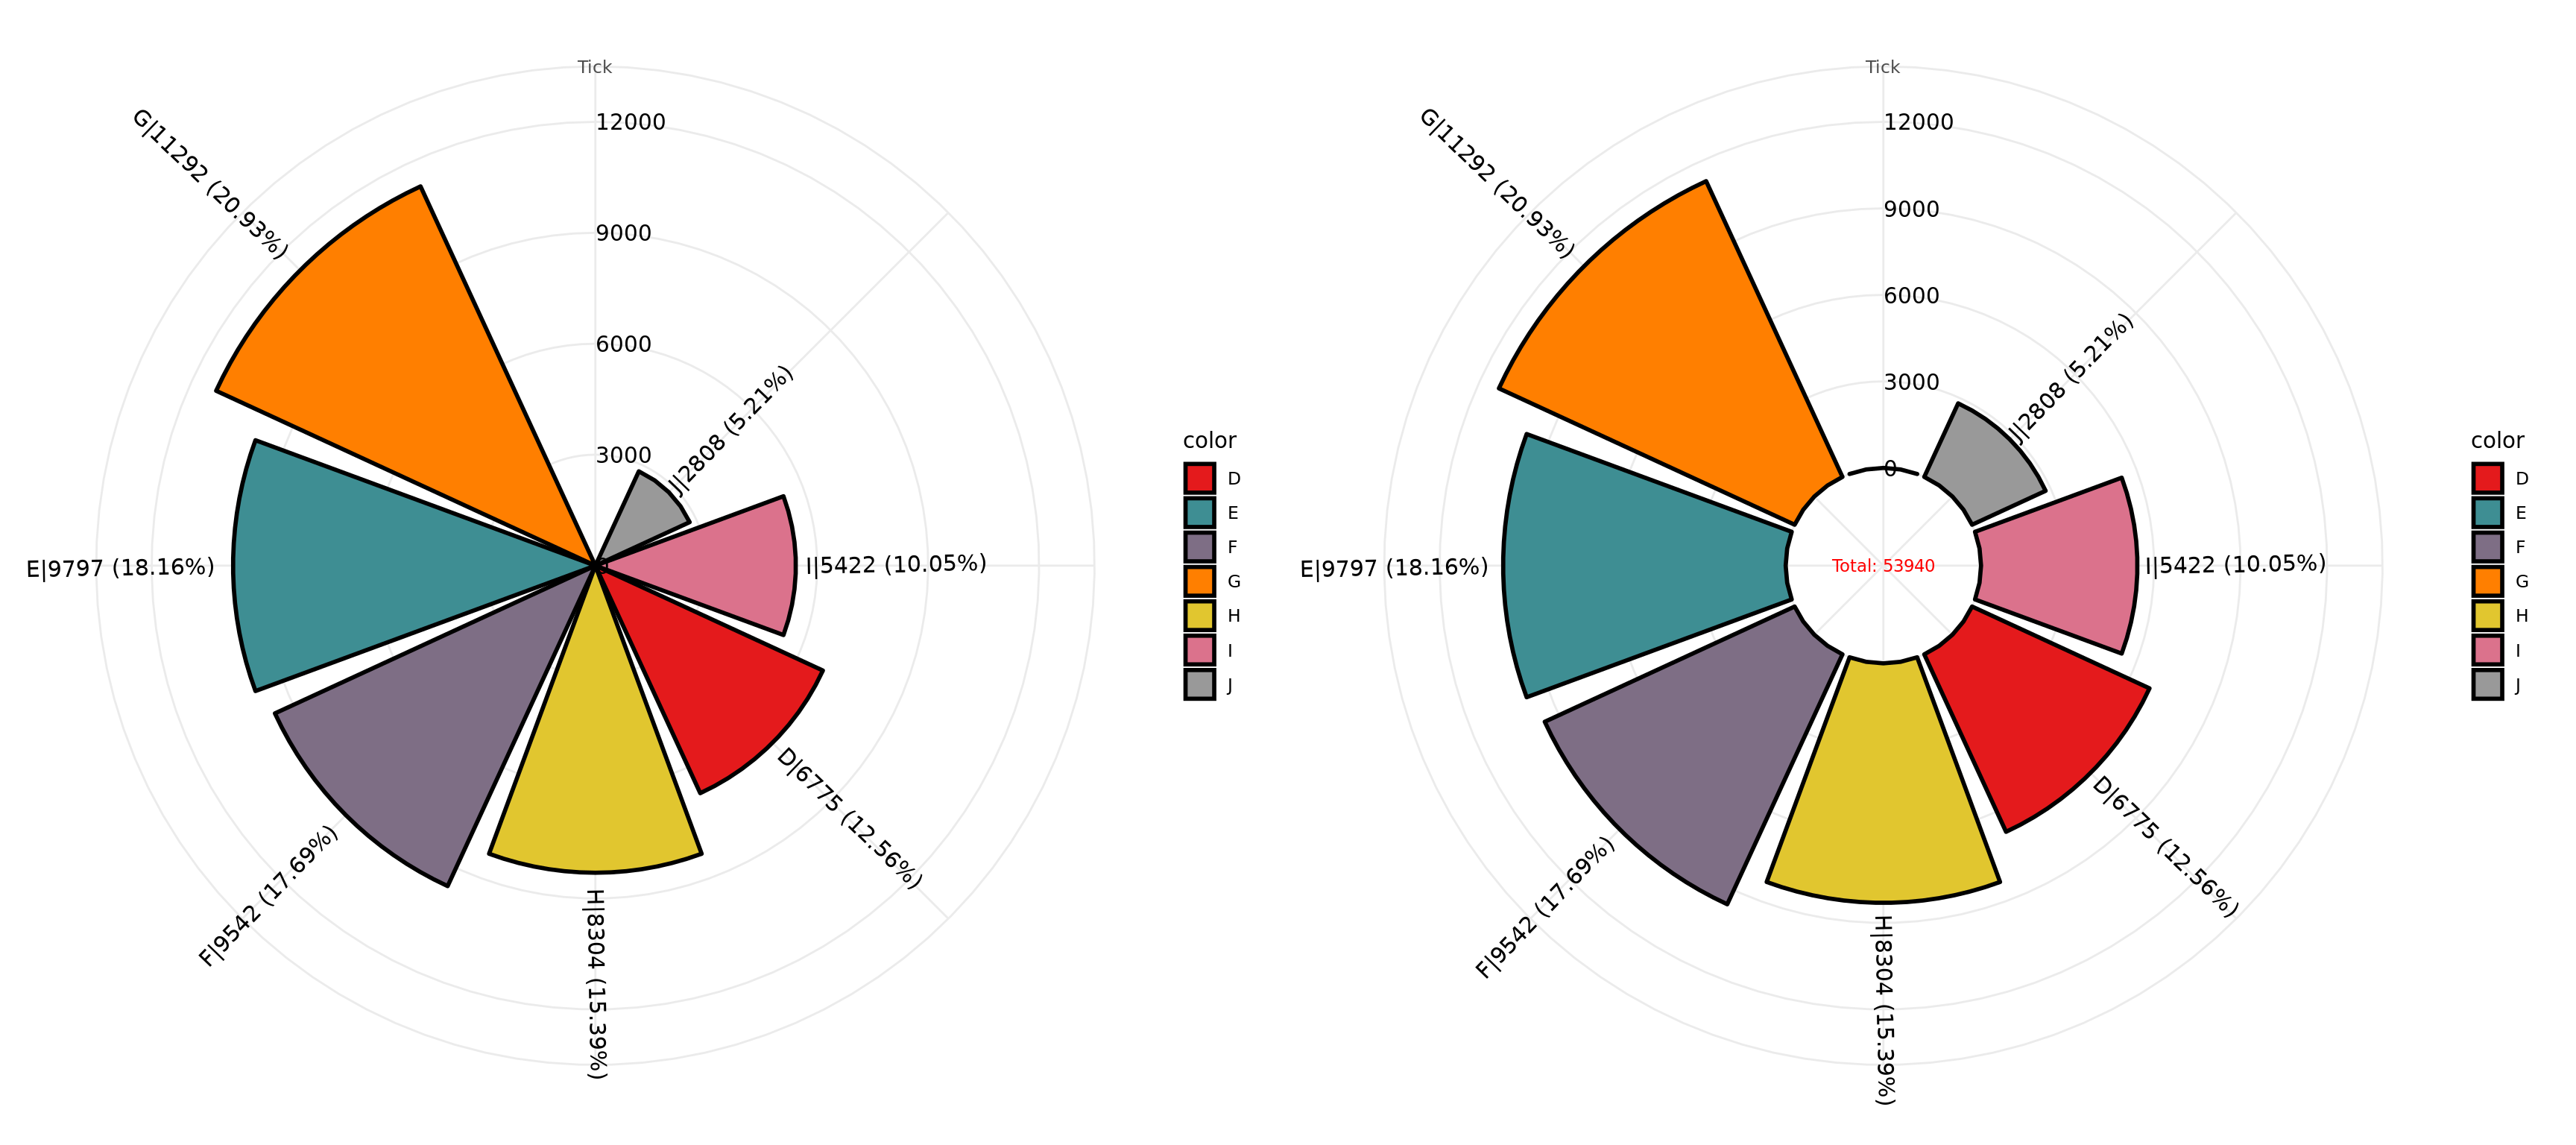
show tick and select breaks automaticly:
# pie plot
p1=ggrosepie(diamonds, group_key = "color", count_type = "full", label_info = "all",
             donut_frac=NULL)
# donut plot
p2=ggrosepie(diamonds, group_key = "color", count_type = "full", label_info = "all",
             donut_frac=0.3,donut_label_size=3)
cowplot::plot_grid(p1,p2)
show tick and with specific breaks:
# pie plot
p1=ggrosepie(diamonds, group_key = "color", count_type = "full", label_info = "all",
             tick_break = c(3000,5000,7000,11000), donut_frac=NULL)
# donut plot
p2=ggrosepie(diamonds, group_key = "color", count_type = "full", label_info = "all",
             tick_break = c(3000,5000,7000,11000), donut_frac=0.3,donut_label_size=3)
cowplot::plot_grid(p1,p2)

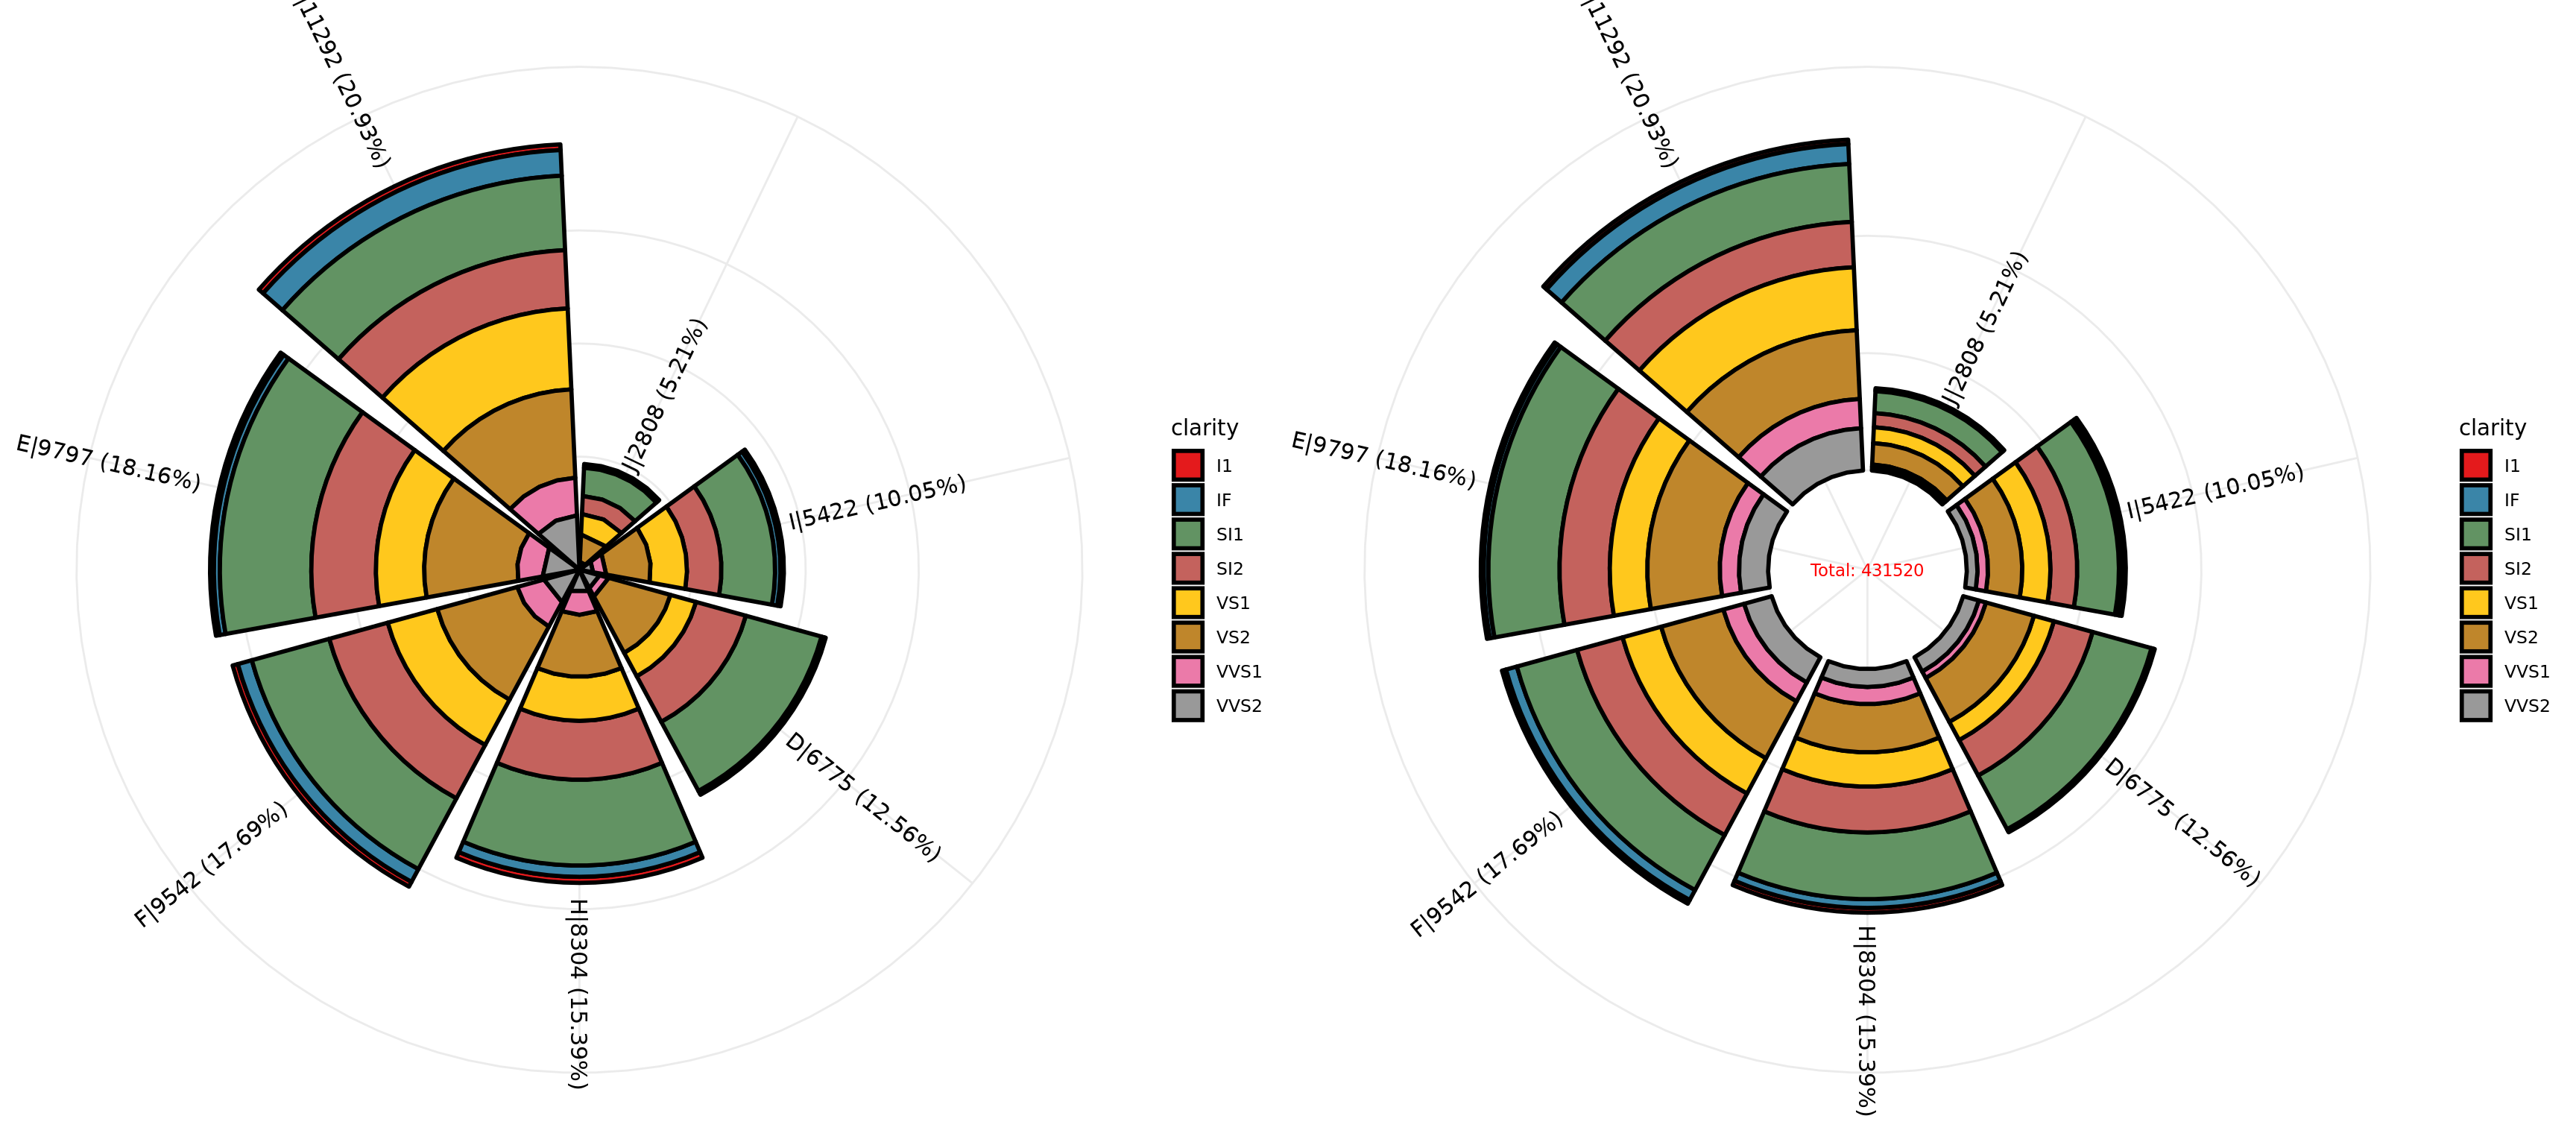
two variables
do not show tick:
# pie plot
p1=ggrosepie(diamonds, group_key = c("color","clarity"),
             count_type = "full", label_info = "all",
             show_tick=F,donut_frac=NULL)
# donut plot
p2=ggrosepie(diamonds, group_key = c("color","clarity"),
             count_type = "full", label_info = "all",
             show_tick=F,donut_frac=0.3,donut_label_size=3)
cowplot::plot_grid(p1,p2)
show tick and select breaks automaticly:
# pie plot
p1=ggrosepie(diamonds, group_key = c("color","clarity"),
             count_type = "full", label_info = "all",
             donut_frac=NULL)
# donut plot
p2=ggrosepie(diamonds, group_key = c("color","clarity"),
             count_type = "full", label_info = "all",
             donut_frac=0.3,donut_label_size=3)
cowplot::plot_grid(p1,p2)

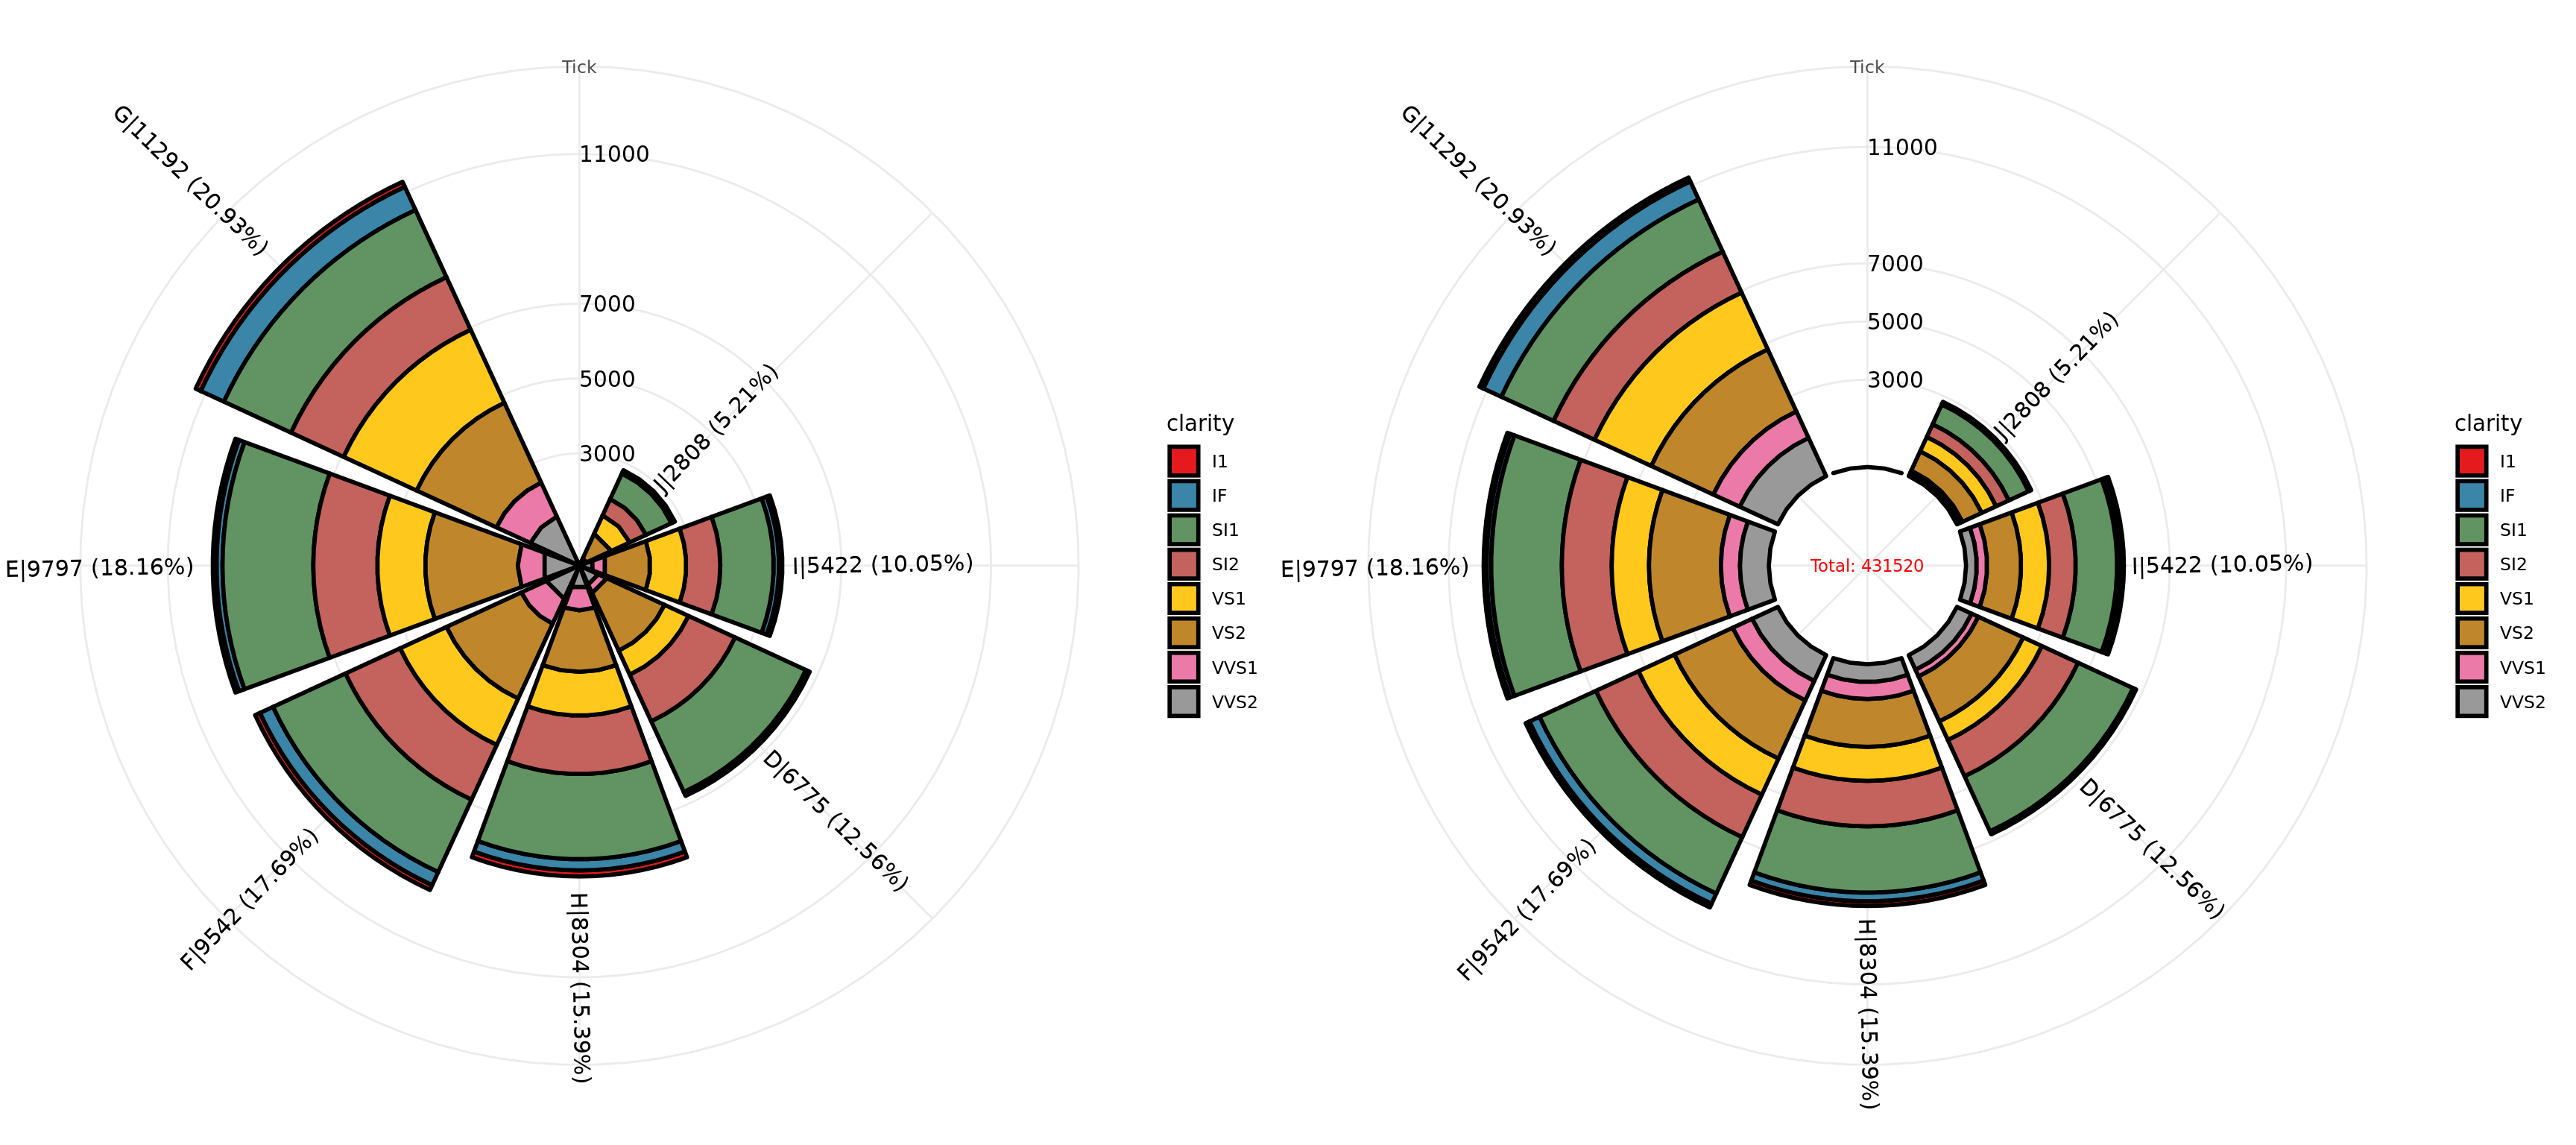
show tick and with specific breaks:
# pie plot
p1=ggrosepie(diamonds, group_key = c("color","clarity"),
             count_type = "full", label_info = "all",
             tick_break = c(3000,5000,7000,11000), donut_frac=NULL)
# donut plot
p2=ggrosepie(diamonds, group_key = c("color","clarity"),
             count_type = "full", label_info = "all",
             tick_break = c(3000,5000,7000,11000), donut_frac=0.3,donut_label_size=3)
cowplot::plot_grid(p1,p2)