FunctionalEnrichmentAnalysis
FunctionalEnrichmentAnalysis.RmdIntroduction
After DE analysis, functional enrichment analysis is often performed to interpret the results of RNA-seq.
DEbPeak provides three kinds of functional enrichment analysis based on clusterProfiler:
- Gene ontology (GO) analysis with DEGs
- Kyoto Encyclopedia of Genes and Genomes (KEGG) pathway enrichment analysis with DEGs
- Gene Set Enrichment Analysis (GSEA)
Example data
We will used the results output by “Quality Control” vignette.
# library
suppressWarnings(suppressMessages(library(DESeq2)))
suppressWarnings(suppressMessages(library(DEbPeak)))
# load data
load(file = "/home/songyabing/R/learn/tmp/DEbPeak/example.RData")
Differential Expression Analysis
We will use DESeq2 as example:
# set control level
dds$condition <- relevel(dds$condition, ref = "WT")
# conduct differential expressed genes analysis
dds <- DESeq(dds)
## estimating size factors## estimating dispersions## gene-wise dispersion estimates## mean-dispersion relationship## final dispersion estimates## fitting model and testing
# extract results
dds.results <- results(dds,contrast=c("condition",'KO','WT'))
dds.results.ordered <- dds.results[order(dds.results$log2FoldChange,decreasing = TRUE),]
head(dds.results.ordered)
## log2 fold change (MLE): condition KO vs WT
## Wald test p-value: condition KO vs WT
## DataFrame with 6 rows and 6 columns
## baseMean log2FoldChange lfcSE stat pvalue
## <numeric> <numeric> <numeric> <numeric> <numeric>
## ENSMUSG00000025934.15 2.01093 4.46030 3.01742 1.47818 NA
## ENSMUSG00000105597.1 1.64376 4.16931 2.98872 1.39502 0.163011113
## ENSMUSG00000109866.1 2.32064 4.14573 1.22504 3.38415 0.000713987
## ENSMUSG00000085819.7 2.23441 4.07496 1.65939 2.45569 0.014061354
## ENSMUSG00000102474.1 1.52867 4.06781 1.80781 2.25013 0.024440396
## ENSMUSG00000042677.7 1.49781 4.05394 1.71350 2.36588 0.017987495
## padj
## <numeric>
## ENSMUSG00000025934.15 NA
## ENSMUSG00000105597.1 0.99973
## ENSMUSG00000109866.1 0.99973
## ENSMUSG00000085819.7 0.99973
## ENSMUSG00000102474.1 0.99973
## ENSMUSG00000042677.7 0.99973GO enrichment
# save results to working directory
# ConductFE(deres = dds.results.ordered, signif = "pvalue", l2fc.threshold = 0.3,enrich.type = "GO")
all.go.results=ConductFE(deres = dds.results.ordered, signif = "pvalue", l2fc.threshold = 0.3,enrich.type = "GO",str.width = 50, save = F)
Up regulated genes
Overview
up.go.res=all.go.results[["UP"]][["GO"]]
up.go.res.table=up.go.res[["table"]]
head(up.go.res.table)
## ONTOLOGY ID Description
## GO:0097060 CC GO:0097060 synaptic membrane
## GO:0099240 CC GO:0099240 intrinsic component of synaptic membrane
## GO:0014069 CC GO:0014069 postsynaptic density
## GO:0032279 CC GO:0032279 asymmetric synapse
## GO:0098839 CC GO:0098839 postsynaptic density membrane
## GO:0098984 CC GO:0098984 neuron to neuron synapse
## GeneRatio BgRatio pvalue p.adjust qvalue
## GO:0097060 15/231 470/23271 7.783967e-05 0.01822125 0.01447238
## GO:0099240 10/231 244/23271 1.732798e-04 0.01822125 0.01447238
## GO:0014069 13/231 400/23271 1.957825e-04 0.01822125 0.01447238
## GO:0032279 13/231 405/23271 2.208636e-04 0.01822125 0.01447238
## GO:0098839 6/231 97/23271 4.175021e-04 0.01868255 0.01483877
## GO:0098984 13/231 433/23271 4.183638e-04 0.01868255 0.01483877
## geneID
## GO:0097060 Slc6a2/Met/Nt5e/Lpar2/Grik1/Tenm2/Tiam1/Abhd6/Rgs7bp/Epha7/Snap25/Atp2b2/Adcy1/Adgrl2/Cacng2
## GO:0099240 Lpar2/Grik1/Abhd6/Rgs7bp/Epha7/Snap25/Atp2b2/Adcy1/Adgrl2/Cacng2
## GO:0014069 Nefh/Met/Grik1/Rapgef4/Tiam1/Rgs7bp/Epha7/Ctnnd2/Map1b/Atp2b2/Pak2/Adcy1/Cacng2
## GO:0032279 Nefh/Met/Grik1/Rapgef4/Tiam1/Rgs7bp/Epha7/Ctnnd2/Map1b/Atp2b2/Pak2/Adcy1/Cacng2
## GO:0098839 Tiam1/Rgs7bp/Epha7/Atp2b2/Adcy1/Cacng2
## GO:0098984 Nefh/Met/Grik1/Rapgef4/Tiam1/Rgs7bp/Epha7/Ctnnd2/Map1b/Atp2b2/Pak2/Adcy1/Cacng2
## Count
## GO:0097060 15
## GO:0099240 10
## GO:0014069 13
## GO:0032279 13
## GO:0098839 6
## GO:0098984 13
Visualize selected terms
Here, we can visualize selected terms with EnrichPlot.
Extract results:
# get all go results
all.up.go.fe.res = all.go.results$UP$GO$table
# extract MF
up.go.mf.fe.res = all.up.go.fe.res[all.up.go.fe.res$ONTOLOGY=="MF",]
# select terms to plot
up.go.mf.selected = up.go.mf.fe.res[up.go.mf.fe.res$ID %in% c("GO:0017016", "GO:0031267", "GO:0017048", "GO:0005085", "GO:0005088"), ]
Create bar plot:
# create bar plot
EnrichPlot(fe.res = up.go.mf.selected, grad.col.vec=c("grey", "red"))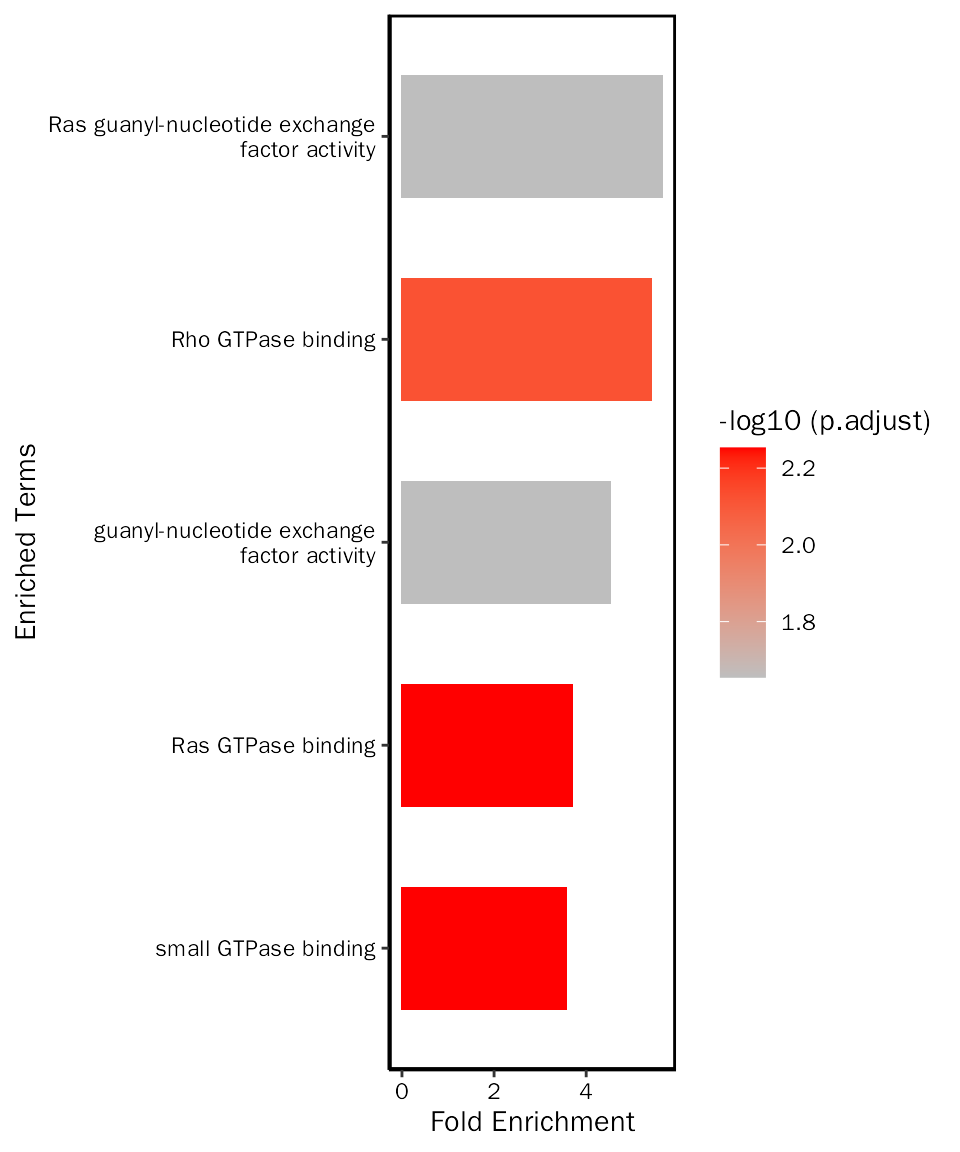
Create dot plot:
# create dot plot
EnrichPlot(fe.res = up.go.mf.selected, grad.col.vec=c("grey", "red"), plot.type = "dot")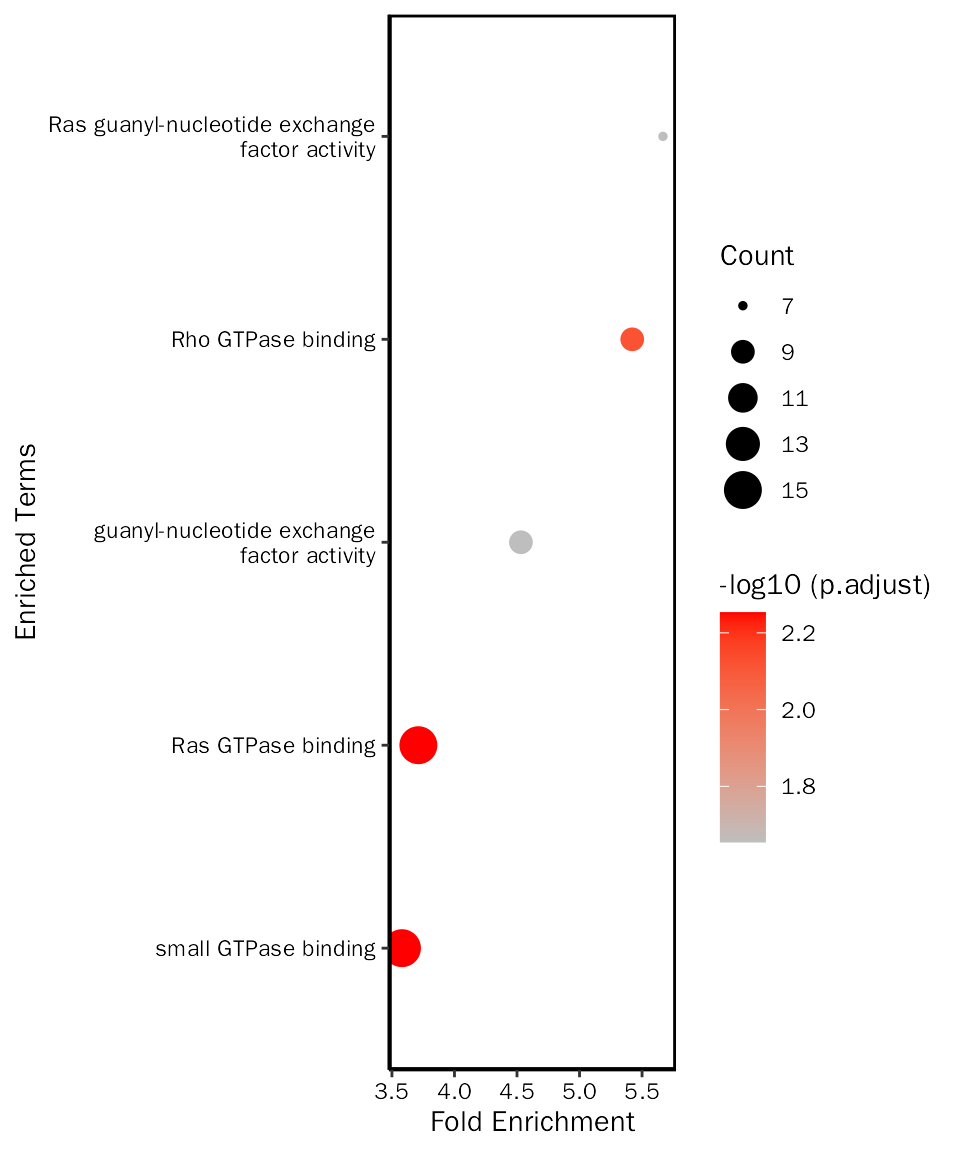
Down regulated genes
Overview
down.go.res=all.go.results[["DOWN"]][["GO"]]
down.go.res.table = down.go.res[["table"]]
head(down.go.res.table)
## ONTOLOGY ID Description GeneRatio BgRatio
## GO:0005604 CC GO:0005604 basement membrane 7/229 114/23271
## pvalue p.adjust qvalue
## GO:0005604 0.0001374573 0.04178703 0.04007966
## geneID Count
## GO:0005604 Ntn4/Ntn1/Col4a2/Egflam/Papln/Fras1/Col4a4 7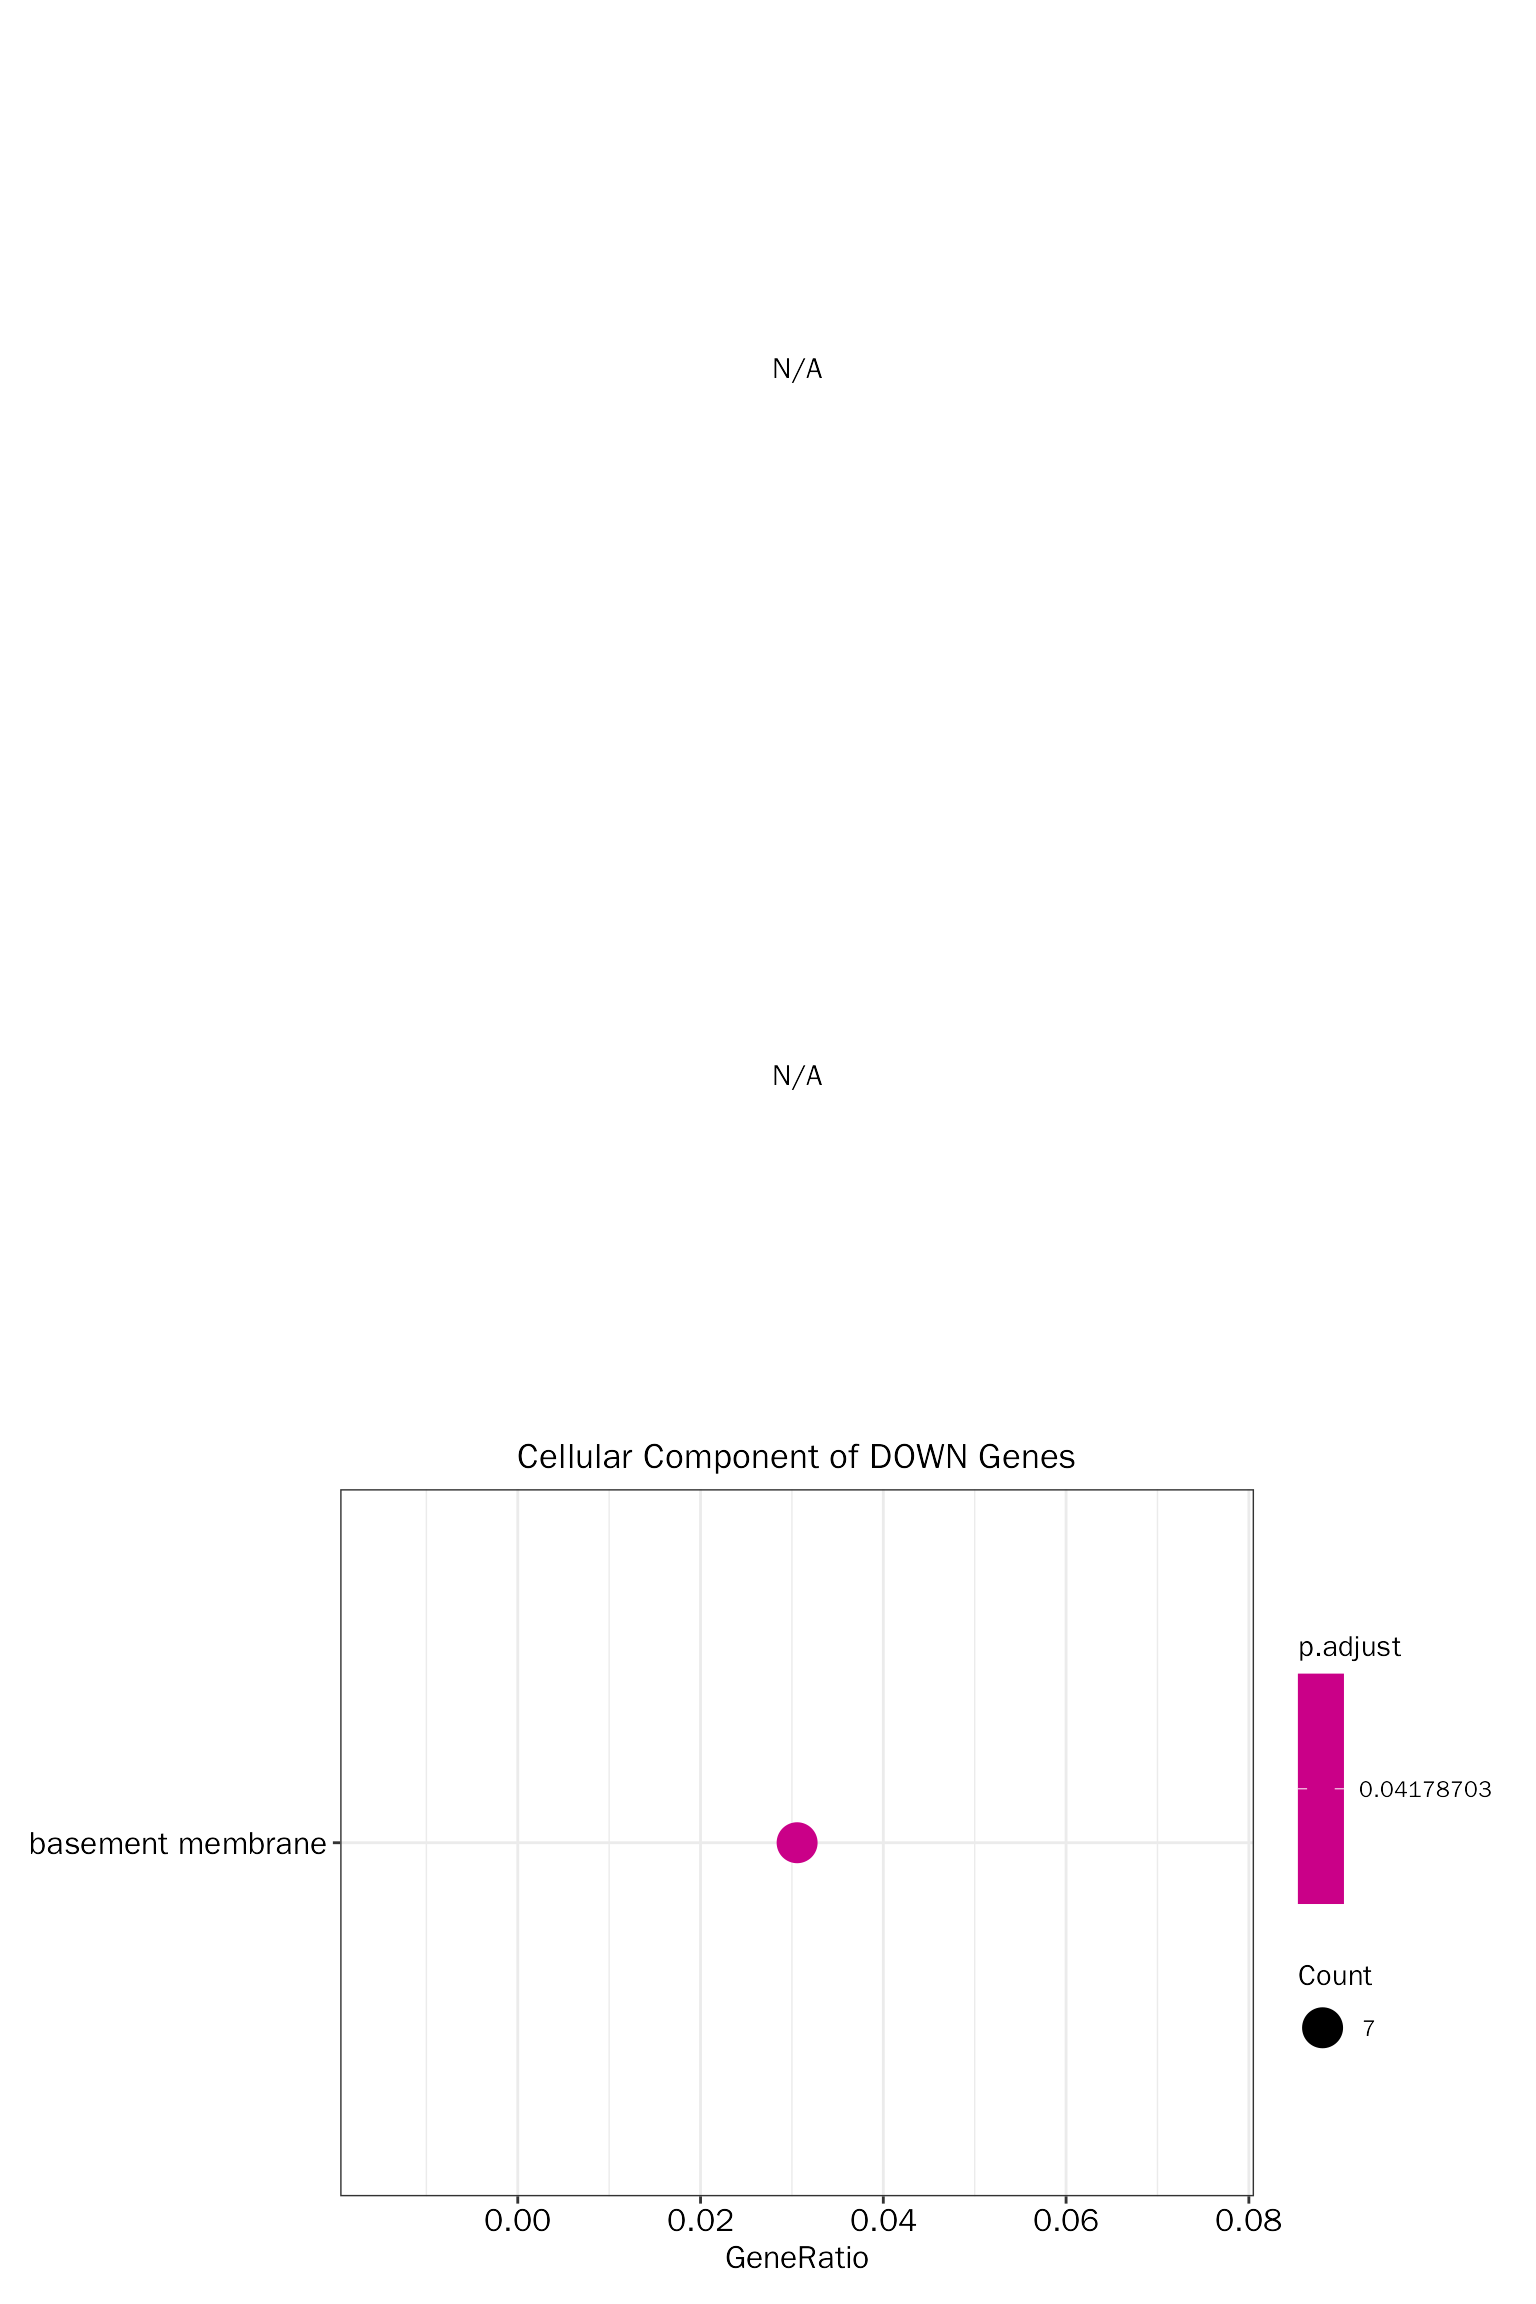
Visualize selected terms
Here, we can visualize selected terms with EnrichPlot.
Extract results:
# get all go results
all.down.go.fe.res = all.go.results$DOWN$GO$table
# extract MF
down.go.cc.fe.res = all.down.go.fe.res[all.down.go.fe.res$ONTOLOGY=="CC",]
# select terms to plot
down.go.cc.selected = down.go.cc.fe.res[down.go.cc.fe.res$ID %in% c("GO:0005604"), ]
Create bar plot:
# create bar plot
EnrichPlot(fe.res = down.go.cc.selected, grad.col.vec=c("grey", "red"))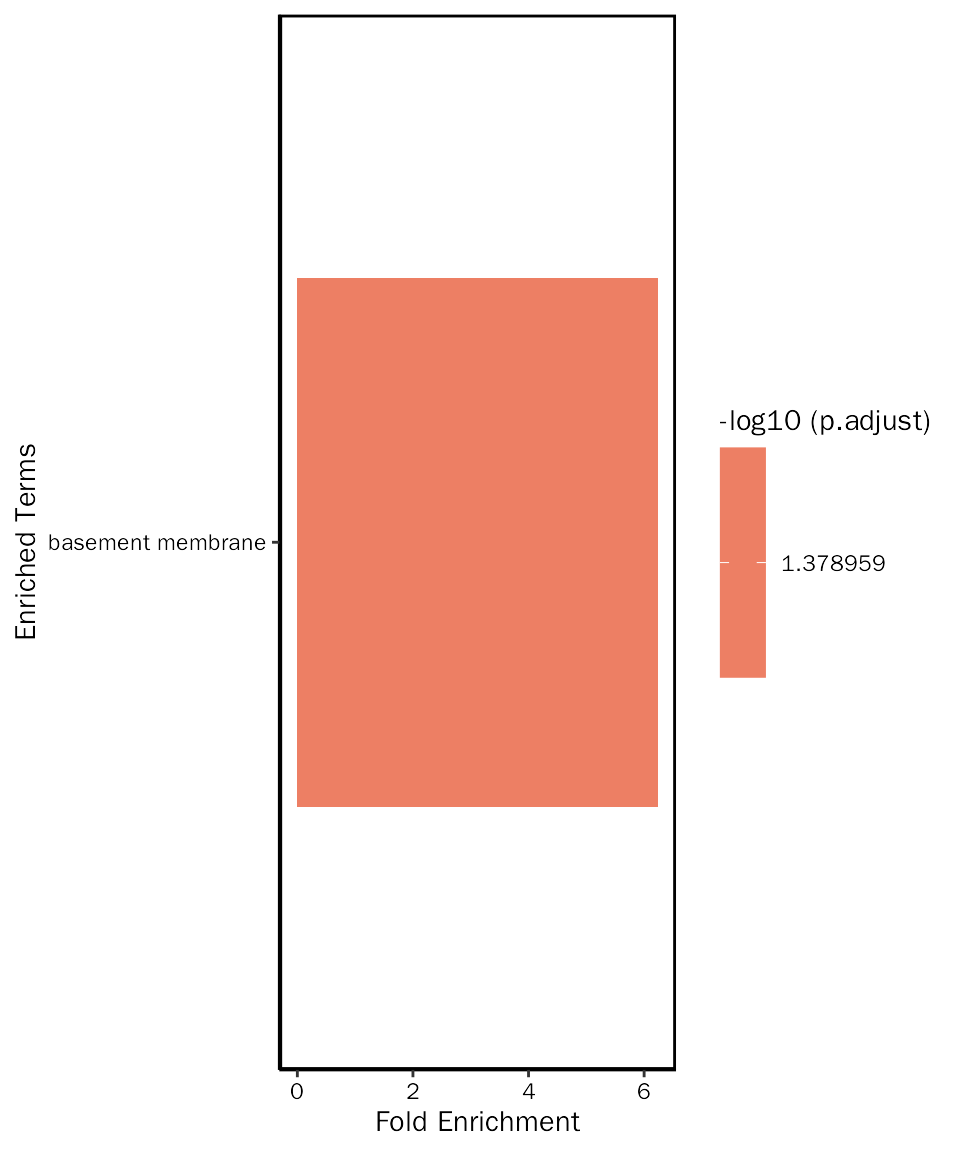
Create dot plot:
# create dot plot
EnrichPlot(fe.res = down.go.cc.selected, grad.col.vec=c("grey", "red"), plot.type = "dot")
KEGG enrichment
# save results to working directory
# ConductFE(deres = dds.results.ordered, signif = "pvalue", l2fc.threshold = 0.3,enrich.type = "KEGG")
all.kegg.results=ConductFE(deres = dds.results.ordered, signif = "pvalue", l2fc.threshold = 0.3,enrich.type = "KEGG", str.width = 50, save = F)
Up regulated genes
Overview
up.kegg.res=all.kegg.results[["UP"]][["KEGG"]]
up.kegg.res.table=up.kegg.res[["table"]]
head(up.kegg.res.table)
## ID Description GeneRatio
## mmu04911 mmu04911 Insulin secretion - Mus musculus (house mouse) 7/105
## mmu04024 mmu04024 cAMP signaling pathway - Mus musculus (house mouse) 10/105
## BgRatio pvalue p.adjust qvalue
## mmu04911 86/9270 5.045935e-05 0.01120198 0.01009187
## mmu04024 224/9270 2.155612e-04 0.02392729 0.02155612
## geneID Count
## mmu04911 Kcnmb2/Kcnn3/Creb5/Rapgef4/Creb3l2/Snap25/Adcy1 7
## mmu04024 Cftr/Atp2a3/Creb5/Rapgef4/Tiam1/Creb3l2/Sox9/Atp2b2/Crebbp/Adcy1 10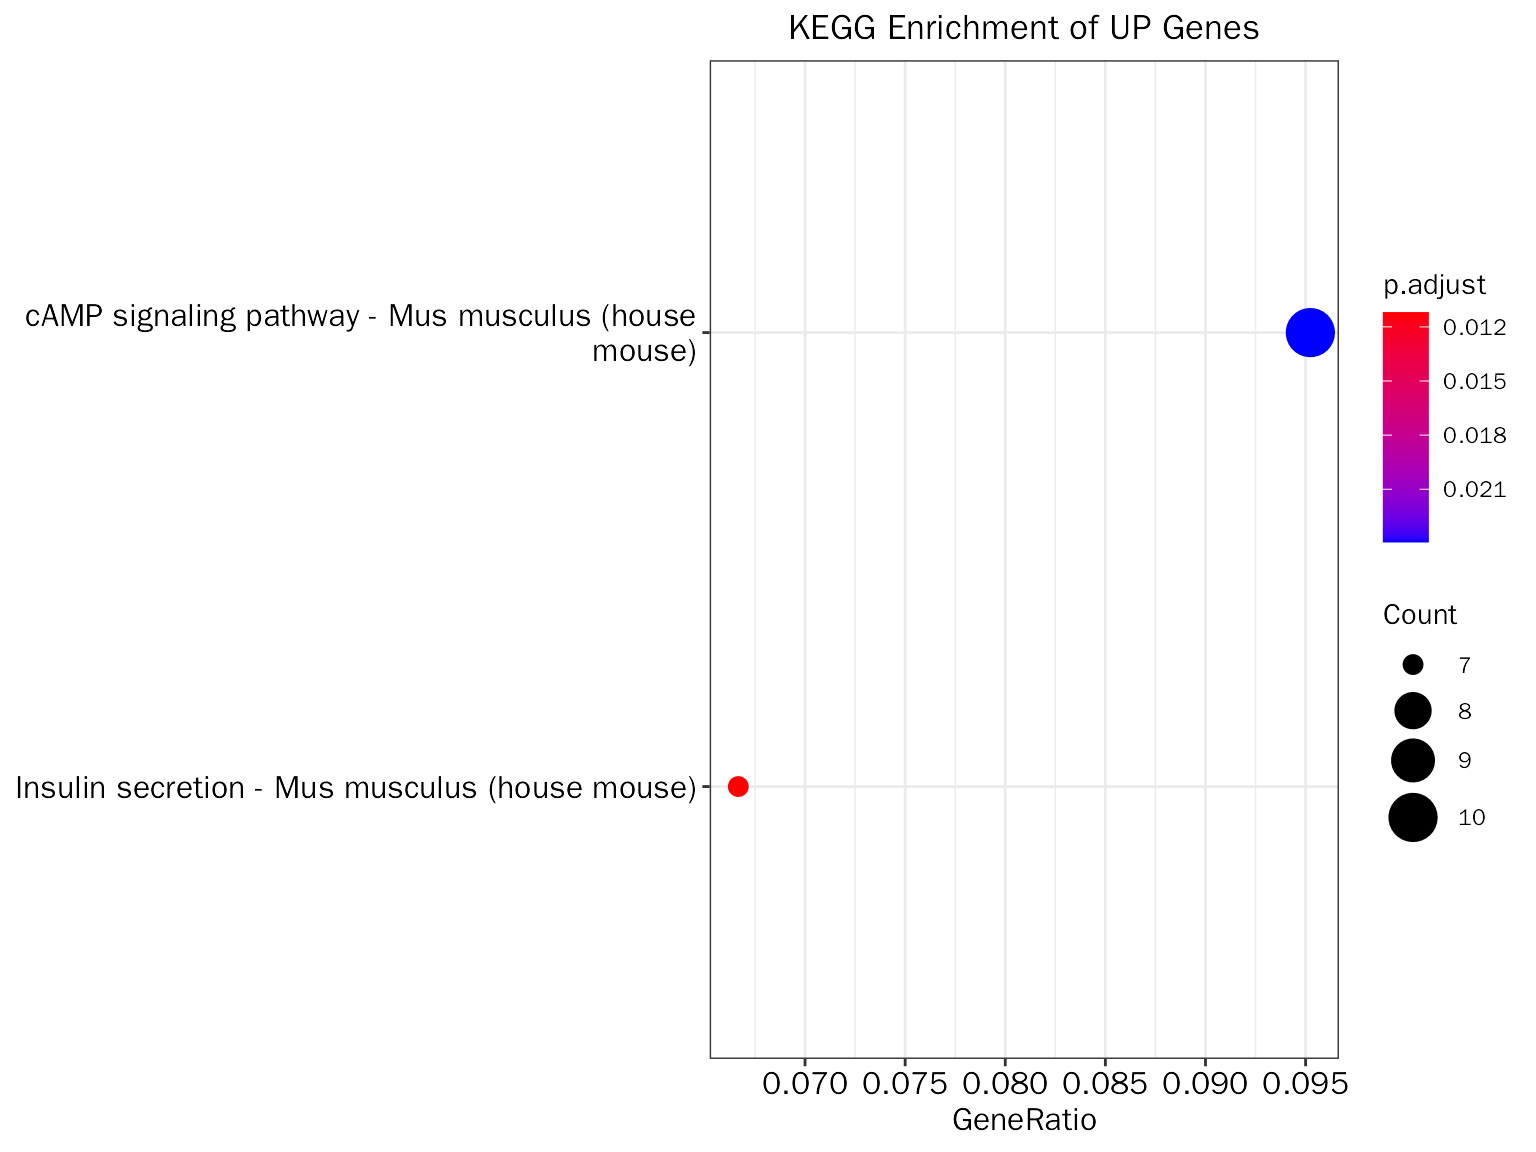
Visualize selected terms
Here, we can visualize selected terms with EnrichPlot.
Extract results:
# get all kegg results
all.up.kegg.fe.res = all.kegg.results$UP$KEGG$table
# select terms to plot
up.kegg.selected = all.up.kegg.fe.res[all.up.kegg.fe.res$ID %in% c("mmu04911", "mmu04024"), ]
Create bar plot:
# create bar plot
EnrichPlot(fe.res = up.kegg.selected, grad.col.vec=c("grey", "red"))
Create dot plot:
# create dot plot
EnrichPlot(fe.res = up.kegg.selected, grad.col.vec=c("grey", "red"), plot.type = "dot")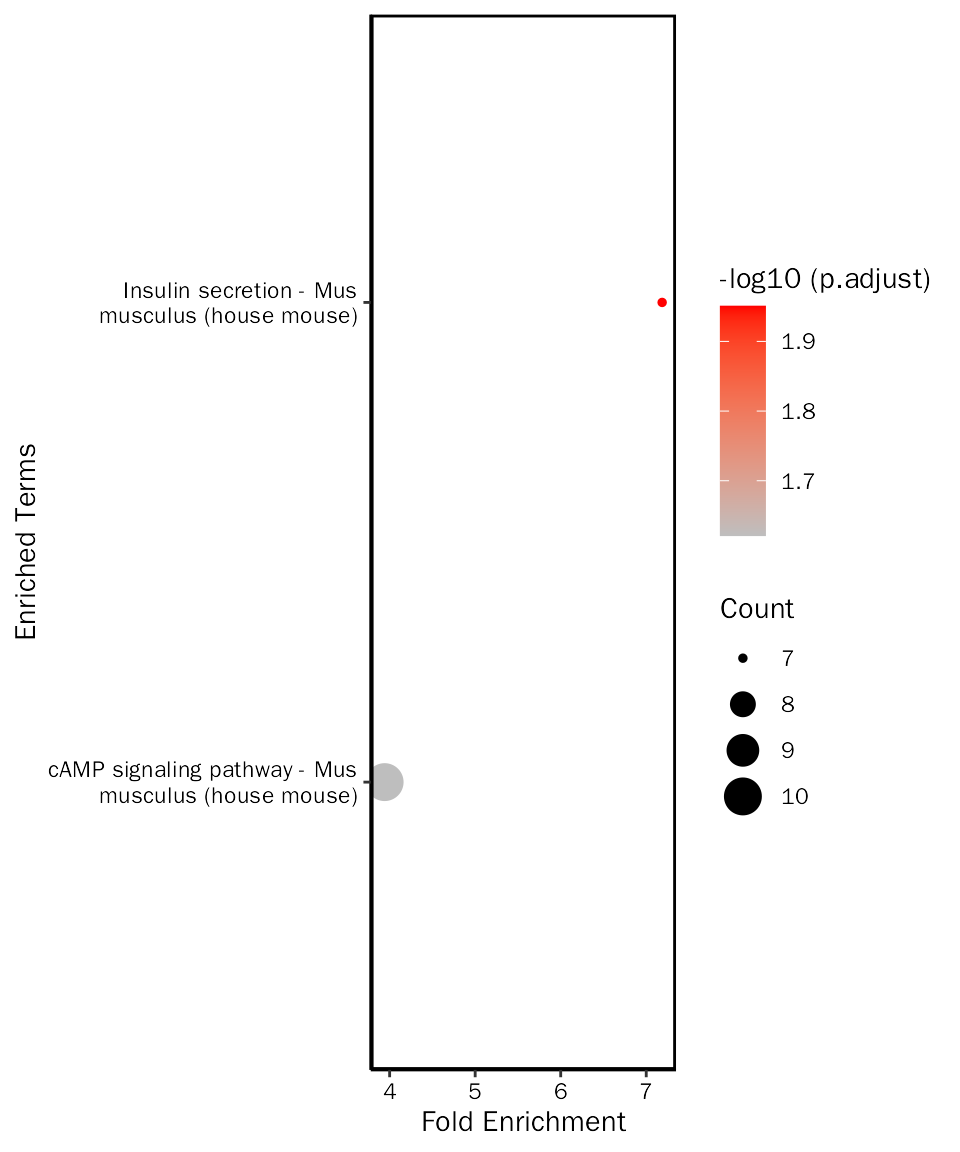
Down regulated genes
Overview
down.kegg.res=all.kegg.results[["DOWN"]][["KEGG"]]
down.kegg.res.table=down.kegg.res[["table"]]
head(down.kegg.res.table)
## [1] ID Description GeneRatio BgRatio pvalue p.adjust
## [7] qvalue geneID Count
## <0 行> (或0-长度的row.names)
Visualize selected terms
Here, we can visualize selected terms with EnrichPlot.
Extract results:
# get all kegg results
all.down.kegg.fe.res = all.kegg.results$DOWN$KEGG$table
# select terms to plot
down.kegg.selected = all.down.kegg.fe.res
Create bar plot:
# create bar plot
EnrichPlot(fe.res = down.kegg.selected, grad.col.vec=c("grey", "red"))
Create dot plot:
# create dot plot
EnrichPlot(fe.res = down.kegg.selected, grad.col.vec=c("grey", "red"), plot.type = "dot")
GSEA
Gene Set Enrichment Analysis (GSEA) is a computational method that determines whether an a priori defined set of genes shows statistically significant, concordant differences between two biological states(e.g. phenotypes). Different from GO and KEGG based on DEGs, GSEA is based on whole gene expression matrix without prior gene filtering.
While GSEA requires priori defined set of genes, for human, we can download gmt file from MSigDB, for other species, we can obtain gene sets via msigdbr.
All available gene sets
library(msigdbr)
# list all possible species
msigdbr_species()
## # A tibble: 20 × 2
## species_name species_common_name
## <chr> <chr>
## 1 Anolis carolinensis Carolina anole, green anole
## 2 Bos taurus bovine, cattle, cow, dairy cow, domestic cat…
## 3 Caenorhabditis elegans roundworm
## 4 Canis lupus familiaris dog, dogs
## 5 Danio rerio leopard danio, zebra danio, zebra fish, zebr…
## 6 Drosophila melanogaster fruit fly
## 7 Equus caballus domestic horse, equine, horse
## 8 Felis catus cat, cats, domestic cat
## 9 Gallus gallus bantam, chicken, chickens, Gallus domesticus
## 10 Homo sapiens human
## 11 Macaca mulatta rhesus macaque, rhesus macaques, Rhesus monk…
## 12 Monodelphis domestica gray short-tailed opossum
## 13 Mus musculus house mouse, mouse
## 14 Ornithorhynchus anatinus duck-billed platypus, duckbill platypus, pla…
## 15 Pan troglodytes chimpanzee
## 16 Rattus norvegicus brown rat, Norway rat, rat, rats
## 17 Saccharomyces cerevisiae baker's yeast, brewer's yeast, S. cerevisiae
## 18 Schizosaccharomyces pombe 972h- <NA>
## 19 Sus scrofa pig, pigs, swine, wild boar
## 20 Xenopus tropicalis tropical clawed frog, western clawed frog
# create gene sets
m_t2g <- msigdbr(species = "Mus musculus", category = "C5", subcategory = "BP") %>%
  dplyr::select(gs_name, entrez_gene)
head(m_t2g)
## # A tibble: 6 × 2
## gs_name entrez_gene
## <chr> <int>
## 1 GOBP_10_FORMYLTETRAHYDROFOLATE_METABOLIC_PROCESS 67618
## 2 GOBP_10_FORMYLTETRAHYDROFOLATE_METABOLIC_PROCESS 107747
## 3 GOBP_10_FORMYLTETRAHYDROFOLATE_METABOLIC_PROCESS 216188
## 4 GOBP_10_FORMYLTETRAHYDROFOLATE_METABOLIC_PROCESS 108156
## 5 GOBP_10_FORMYLTETRAHYDROFOLATE_METABOLIC_PROCESS 270685
## 6 GOBP_10_FORMYLTETRAHYDROFOLATE_METABOLIC_PROCESS 665563GSEA
gsea.results=ConductGSEA(deres = dds.results.ordered,gmt.file = NULL,gene.sets = m_t2g,save = F)Overview
gsea.results.table=gsea.results[["table"]]
head(gsea.results.table)
## [1] ID Description setSize enrichmentScore
## [5] NES pvalue p.adjust qvalues
## <0 行> (或0-长度的row.names)Session info
## R version 4.0.3 (2020-10-10)
## Platform: x86_64-conda-linux-gnu (64-bit)
## Running under: CentOS Linux 7 (Core)
##
## Matrix products: default
## BLAS/LAPACK: /home/softwares/anaconda3/envs/r4.0/lib/libopenblasp-r0.3.12.so
##
## locale:
##  [1] LC_CTYPE=zh_CN.UTF-8       LC_NUMERIC=C
##  [3] LC_TIME=zh_CN.UTF-8        LC_COLLATE=zh_CN.UTF-8
##  [5] LC_MONETARY=zh_CN.UTF-8    LC_MESSAGES=zh_CN.UTF-8
##  [7] LC_PAPER=zh_CN.UTF-8       LC_NAME=C
##  [9] LC_ADDRESS=C               LC_TELEPHONE=C
## [11] LC_MEASUREMENT=zh_CN.UTF-8 LC_IDENTIFICATION=C
##
## attached base packages:
## [1] stats4    stats     graphics  grDevices utils     datasets  methods
## [8] base
##
## other attached packages:
##  [1] msigdbr_7.5.1               org.Mm.eg.db_3.12.0
##  [3] AnnotationDbi_1.52.0        DEbPeak_1.4.0
##  [5] DESeq2_1.30.1               SummarizedExperiment_1.20.0
##  [7] Biobase_2.50.0              MatrixGenerics_1.2.1
##  [9] matrixStats_0.58.0          GenomicRanges_1.42.0
## [11] GenomeInfoDb_1.26.7         IRanges_2.24.1
## [13] S4Vectors_0.28.1            BiocGenerics_0.42.0
##
## loaded via a namespace (and not attached):
##   [1] rsvd_1.0.3
##   [2] ggvenn_0.1.9
##   [3] apeglm_1.12.0
##   [4] Rsamtools_2.6.0
##   [5] rsvg_2.1
##   [6] foreach_1.5.1
##   [7] rprojroot_2.0.2
##   [8] crayon_1.4.1
##   [9] V8_3.4.2
##  [10] MASS_7.3-58
##  [11] nlme_3.1-152
##  [12] backports_1.2.1
##  [13] sva_3.38.0
##  [14] GOSemSim_2.25.0
##  [15] rlang_1.1.0
##  [16] XVector_0.30.0
##  [17] readxl_1.4.2
##  [18] irlba_2.3.5
##  [19] limma_3.46.0
##  [20] GOstats_2.56.0
##  [21] BiocParallel_1.24.1
##  [22] rjson_0.2.20
##  [23] bit64_4.0.5
##  [24] glue_1.6.2
##  [25] DiffBind_3.0.15
##  [26] mixsqp_0.3-43
##  [27] pheatmap_1.0.12
##  [28] parallel_4.0.3
##  [29] DEFormats_1.18.0
##  [30] base64url_1.4
##  [31] tcltk_4.0.3
##  [32] DOSE_3.23.2
##  [33] haven_2.5.2
##  [34] tidyselect_1.2.0
##  [35] rio_0.5.27
##  [36] XML_3.99-0.6
##  [37] tidyr_1.3.0
##  [38] ggpubr_0.4.0
##  [39] GenomicAlignments_1.26.0
##  [40] xtable_1.8-4
##  [41] ggnetwork_0.5.12
##  [42] magrittr_2.0.3
##  [43] evaluate_0.14
##  [44] ggplot2_3.4.2
##  [45] cli_3.6.1
##  [46] zlibbioc_1.36.0
##  [47] hwriter_1.3.2
##  [48] rstudioapi_0.14
##  [49] bslib_0.3.1
##  [50] GreyListChIP_1.22.0
##  [51] fastmatch_1.1-3
##  [52] BiocSingular_1.6.0
##  [53] xfun_0.30
##  [54] askpass_1.1
##  [55] clue_0.3-59
##  [56] gson_0.0.9
##  [57] cluster_2.1.1
##  [58] caTools_1.18.2
##  [59] tidygraph_1.2.0
##  [60] tibble_3.2.1
##  [61] ggrepel_0.9.1
##  [62] Biostrings_2.58.0
##  [63] png_0.1-7
##  [64] withr_2.5.0
##  [65] bitops_1.0-6
##  [66] ggforce_0.3.3
##  [67] RBGL_1.66.0
##  [68] plyr_1.8.6
##  [69] cellranger_1.1.0
##  [70] GSEABase_1.52.1
##  [71] pcaPP_2.0-1
##  [72] dqrng_0.2.1
##  [73] coda_0.19-4
##  [74] pillar_1.9.0
##  [75] gplots_3.1.1
##  [76] GlobalOptions_0.1.2
##  [77] cachem_1.0.4
##  [78] GenomicFeatures_1.42.2
##  [79] fs_1.5.0
##  [80] GetoptLong_1.0.5
##  [81] clusterProfiler_4.7.1
##  [82] DelayedMatrixStats_1.12.3
##  [83] vctrs_0.6.2
##  [84] generics_0.1.0
##  [85] plot3D_1.4
##  [86] tools_4.0.3
##  [87] foreign_0.8-81
##  [88] NOISeq_2.34.0
##  [89] munsell_0.5.0
##  [90] tweenr_1.0.2
##  [91] fgsea_1.16.0
##  [92] DelayedArray_0.16.3
##  [93] fastmap_1.1.0
##  [94] compiler_4.0.3
##  [95] abind_1.4-5
##  [96] rtracklayer_1.50.0
##  [97] TxDb.Hsapiens.UCSC.hg19.knownGene_3.2.2
##  [98] GenomeInfoDbData_1.2.4
##  [99] gridExtra_2.3
## [100] edgeR_3.32.1
## [101] lattice_0.20-45
## [102] ggnewscale_0.4.7
## [103] AnnotationForge_1.32.0
## [104] utf8_1.2.1
## [105] dplyr_1.1.2
## [106] BiocFileCache_1.14.0
## [107] jsonlite_1.8.4
## [108] scales_1.2.1
## [109] graph_1.68.0
## [110] carData_3.0-4
## [111] sparseMatrixStats_1.2.1
## [112] TFEA.ChIP_1.10.0
## [113] genefilter_1.72.1
## [114] car_3.0-11
## [115] doParallel_1.0.16
## [116] latticeExtra_0.6-29
## [117] R.utils_2.12.0
## [118] brew_1.0-6
## [119] checkmate_2.0.0
## [120] rmarkdown_2.14
## [121] openxlsx_4.2.3
## [122] pkgdown_1.6.1
## [123] cowplot_1.1.1
## [124] textshaping_0.3.6
## [125] forcats_1.0.0
## [126] downloader_0.4
## [127] BSgenome_1.58.0
## [128] igraph_1.4.99.9024
## [129] survival_3.2-10
## [130] numDeriv_2016.8-1.1
## [131] yaml_2.2.1
## [132] plotrix_3.8-2
## [133] systemfonts_1.0.4
## [134] ashr_2.2-47
## [135] SQUAREM_2021.1
## [136] htmltools_0.5.2
## [137] memoise_2.0.0
## [138] VariantAnnotation_1.36.0
## [139] locfit_1.5-9.4
## [140] graphlayouts_0.7.1
## [141] batchtools_0.9.15
## [142] PCAtools_2.2.0
## [143] viridisLite_0.4.0
## [144] rrcov_1.7-0
## [145] digest_0.6.27
## [146] assertthat_0.2.1
## [147] rappdirs_0.3.3
## [148] emdbook_1.3.12
## [149] RSQLite_2.2.5
## [150] amap_0.8-18
## [151] yulab.utils_0.0.4
## [152] debugme_1.1.0
## [153] misc3d_0.9-1
## [154] data.table_1.14.2
## [155] blob_1.2.1
## [156] R.oo_1.24.0
## [157] ragg_0.4.0
## [158] labeling_0.4.2
## [159] splines_4.0.3
## [160] ggupset_0.3.0
## [161] RCurl_1.98-1.3
## [162] broom_1.0.4
## [163] hms_1.1.3
## [164] colorspace_2.0-0
## [165] BiocManager_1.30.16
## [166] shape_1.4.6
## [167] sass_0.4.1
## [168] GEOquery_2.58.0
## [169] Rcpp_1.0.9
## [170] mvtnorm_1.1-2
## [171] circlize_0.4.15
## [172] enrichplot_1.10.2
## [173] fansi_0.4.2
## [174] tzdb_0.3.0
## [175] truncnorm_1.0-8
## [176] ChIPseeker_1.33.0.900
## [177] R6_2.5.0
## [178] grid_4.0.3
## [179] lifecycle_1.0.3
## [180] ShortRead_1.48.0
## [181] zip_2.1.1
## [182] curl_4.3
## [183] ggsignif_0.6.3
## [184] jquerylib_0.1.3
## [185] robustbase_0.95-0
## [186] DO.db_2.9
## [187] Matrix_1.5-4
## [188] qvalue_2.22.0
## [189] desc_1.3.0
## [190] org.Hs.eg.db_3.12.0
## [191] RColorBrewer_1.1-2
## [192] iterators_1.0.13
## [193] stringr_1.5.0
## [194] DOT_0.1
## [195] ggpie_0.2.5
## [196] beachmat_2.6.4
## [197] polyclip_1.10-0
## [198] biomaRt_2.46.3
## [199] purrr_1.0.1
## [200] shadowtext_0.0.9
## [201] gridGraphics_0.5-1
## [202] mgcv_1.8-34
## [203] ComplexHeatmap_2.13.1
## [204] openssl_1.4.3
## [205] patchwork_1.0.0
## [206] bdsmatrix_1.3-4
## [207] codetools_0.2-18
## [208] invgamma_1.1
## [209] GO.db_3.12.1
## [210] gtools_3.8.2
## [211] prettyunits_1.1.1
## [212] dbplyr_2.3.2
## [213] R.methodsS3_1.8.1
## [214] gtable_0.3.0
## [215] DBI_1.1.1
## [216] highr_0.8
## [217] ggfun_0.0.6
## [218] httr_1.4.5
## [219] KernSmooth_2.23-18
## [220] stringi_1.5.3
## [221] progress_1.2.2
## [222] reshape2_1.4.4
## [223] farver_2.1.0
## [224] annotate_1.68.0
## [225] viridis_0.6.1
## [226] Rgraphviz_2.34.0
## [227] xml2_1.3.4
## [228] bbmle_1.0.24
## [229] systemPipeR_1.24.3
## [230] boot_1.3-28
## [231] readr_2.1.4
## [232] geneplotter_1.68.0
## [233] ggplotify_0.1.0
## [234] Category_2.56.0
## [235] DEoptimR_1.0-11
## [236] bit_4.0.4
## [237] scatterpie_0.1.7
## [238] jpeg_0.1-8.1
## [239] ggraph_2.0.5
## [240] babelgene_21.4
## [241] pkgconfig_2.0.3
## [242] rstatix_0.7.0
## [243] knitr_1.37