DifferentialExpressionAnalysisPeak
DifferentialExpressionAnalysisPeak.RmdIntroduction
Here, we will perform differential expression analysis based on DESeq2 and edgeR to get differentially accessible (DA) peaks. Similar to those in Differential Expression Analysis (RNA-seq), DEbPeak provides six differents charts to visualize these DA peaks (VolcanoPlot, ScatterPlot, MAPlot, RankPlot, GenePlot and DEHeatmap).
Example data
The data used here are from In vivo CD8+ T cell CRISPR screening reveals control by Fli1 in infection and cancer:
- RNA-seq data: the sgCtrl vs sgFli1 RNA sequencing at D8 Cl13 p.i., the raw data are stored in GSE149838
- ATAC-seq data: sgCtrl vs sgFli1 ATAC sequencing at D9 Cl13 p.i., the raw data are stored in GSE149836
Count matrix
The raw data:
# read the raw data
atac.counts = utils::read.table(file = "/home/songyabing/R/learn/tmp/DEbPeak/GSE149836_combUnionReadsWithLabels.txt",
                                sep = "\t", header = T)
head(atac.counts)
## chr start end X290_1_S4 X290_2_S5 X360_1_S6 X360_2_S7 R_1_S2 R_2_S3
## 1 chr1 3131803 3131948 2 15 0 3 4 0
## 2 chr1 3210046 3210121 0 1 0 1 0 0
## 3 chr1 3265577 3265648 3 2 0 8 5 2
## 4 chr1 3345206 3345286 3 2 1 0 2 1
## 5 chr1 3505380 3505504 3 4 0 12 4 2
## 6 chr1 3513642 3513745 0 0 2 3 13 2To perform analysis (including Quality Control), we need to preprocess the data (row: feature, column: sample):
# read the processed data, the feature is consist of peak region, gene symbol and annotated binding region.
atac.counts.file = system.file("extdata", "RA_ATAC_count.txt", package = "DEbPeak")
atac.counts = utils::read.table(file = atac.counts.file, sep = "\t", header = T)
head(atac.counts)
## Fli1KO_1 Fli1KO_2 Fli1KO_3
## chr1_GL456211_random:112828-112899|LOC100041034|DI 4 6 14
## chr1_GL456211_random:113055-113190|LOC100041034|DI 7 13 10
## chr1_GL456211_random:147874-147989|LOC100041034|DI 15 16 22
## chr1_GL456211_random:167241-167436|LOC100041034|DI 53 40 43
## chr1_GL456211_random:174677-174747|LOC100041034|I 9 6 17
## chr1_GL456211_random:199244-199444|LOC100041034|DI 23 14 26
## Fli1KO_4 WT_1 WT_2
## chr1_GL456211_random:112828-112899|LOC100041034|DI 12 10 3
## chr1_GL456211_random:113055-113190|LOC100041034|DI 11 21 31
## chr1_GL456211_random:147874-147989|LOC100041034|DI 14 23 27
## chr1_GL456211_random:167241-167436|LOC100041034|DI 54 39 46
## chr1_GL456211_random:174677-174747|LOC100041034|I 6 14 10
## chr1_GL456211_random:199244-199444|LOC100041034|DI 11 27 46If you have raw bam files of input/control and treatment samples and sample metadata, DEbPeak provides PeakMatrix to prepare the above count matrix.
Sample metadata
And, we also need the sample metadata:
# read the processed data
atac.meta.file = system.file("extdata", "RA_ATAC_meta.txt", package = "DEbPeak")
atac.meta = utils::read.table(file = atac.meta.file, sep = "\t", header = T)
head(atac.meta)
## condition
## Fli1KO_1 KO
## Fli1KO_2 KO
## Fli1KO_3 KO
## Fli1KO_4 KO
## WT_1 WT
## WT_2 WTCreate DESeqDataSet
With above data, we can create DESeqDataSet object:
suppressWarnings(suppressMessages(library(DESeq2)))
# create dds
dds.atac <- DESeq2::DESeqDataSetFromMatrix(
  countData = atac.counts, colData = atac.meta,
  design = ~condition
)
## Warning in DESeqDataSet(se, design = design, ignoreRank): some variables in
## design formula are characters, converting to factorsLoad packages
# library
suppressWarnings(suppressMessages(library(DESeq2))) # Already loaded
suppressWarnings(suppressMessages(library(edgeR)))
suppressWarnings(suppressMessages(library(DEbPeak)))
Differential Expression Analysis
To increase flexibility, DEbPeak is compatible with both DESeq2 and edgeR results. We provides standard commands to get DA peaks with both DESeq2 and edgeR.
DESeq2
# set control level
dds.atac$condition <- relevel(dds.atac$condition, ref = "WT")
# conduct differential expressed genes analysis
dds.atac <- DESeq(dds.atac)
## estimating size factors## estimating dispersions## gene-wise dispersion estimates## mean-dispersion relationship## -- note: fitType='parametric', but the dispersion trend was not well captured by the
## function: y = a/x + b, and a local regression fit was automatically substituted.
## specify fitType='local' or 'mean' to avoid this message next time.## final dispersion estimates## fitting model and testing
# extract results
dds.atac.results <- results(dds.atac,contrast=c("condition",'KO','WT'))
dds.atac.results.ordered <- dds.atac.results[order(dds.atac.results$log2FoldChange,decreasing = TRUE),]
head(dds.atac.results.ordered)
## log2 fold change (MLE): condition KO vs WT
## Wald test p-value: condition KO vs WT
## DataFrame with 6 rows and 6 columns
## baseMean log2FoldChange lfcSE
## <numeric> <numeric> <numeric>
## chr8:94825359-94825432|Ciapin1|P 12.10658 6.43921 1.52702
## chr3:105628355-105628501|Ddx20|I 11.18000 6.32317 1.52344
## chr1:118440678-118440831|2900060B14Rik|I 7.83684 5.79091 1.56965
## chr1:165368382-165368517|Dcaf6|I 6.14017 5.43928 1.61963
## chr16:59434969-59435053|Gabrr3|I 5.70677 5.34867 1.63142
## chr11:20780454-20780545|Aftph|DI 5.39047 5.26962 1.63661
## stat pvalue padj
## <numeric> <numeric> <numeric>
## chr8:94825359-94825432|Ciapin1|P 4.21686 2.47728e-05 0.00126570
## chr3:105628355-105628501|Ddx20|I 4.15058 3.31633e-05 0.00159881
## chr1:118440678-118440831|2900060B14Rik|I 3.68931 2.24864e-04 0.00689256
## chr1:165368382-165368517|Dcaf6|I 3.35834 7.84110e-04 0.01786577
## chr16:59434969-59435053|Gabrr3|I 3.27854 1.04345e-03 0.02191561
## chr11:20780454-20780545|Aftph|DI 3.21985 1.28258e-03 0.02530960edgeR
atac.edgeR=DGEList(counts=atac.counts, group=atac.meta$condition)
atac.edgeR <- calcNormFactors(atac.edgeR)
atac.edgeR$samples$group <- relevel(atac.edgeR$samples$group, ref="WT")
design <- model.matrix(~atac.edgeR$samples$group)
atac.edgeR <- estimateDisp(atac.edgeR, design)
fit <- glmQLFit(atac.edgeR, design)
qlf <- glmQLFTest(fit, coef=2)
all.res <- topTags(qlf,n=nrow(atac.edgeR$counts))$table
head(all.res)
## logFC logCPM F
## chr1:24612887-24616152|Col19a1|E -0.289687 15.328812 354.3361
## chr2:146197847-146198364|Cfap61|I -2.240169 5.098303 330.5501
## chr13:74528968-74529954|Zfp825|DI -1.683876 6.121681 248.1321
## chr8:105874405-105874857|Edc4|5U 3.602722 4.205464 232.7117
## chr16:97401751-97402110|Bace2|I -2.972395 3.446204 203.3962
## chr17:13552532-13553181|2700054A10Rik|I -1.588283 5.411427 175.7008
## PValue FDR
## chr1:24612887-24616152|Col19a1|E 2.972132e-49 3.029227e-44
## chr2:146197847-146198364|Cfap61|I 4.119077e-47 2.099102e-42
## chr13:74528968-74529954|Zfp825|DI 6.285243e-39 2.135327e-34
## chr8:105874405-105874857|Edc4|5U 3.039325e-37 7.744275e-33
## chr16:97401751-97402110|Bace2|I 6.970483e-34 1.420877e-29
## chr17:13552532-13553181|2700054A10Rik|I 1.699629e-30 2.887131e-26Stat
Here, we will stat the differential peaks with pie plot to show genomic regions of these differential peaks.
# pie plot for DESeq2
DiffPeakPie(deres = dds.atac.results.ordered, signif="pvalue", l2fc.threshold=0.3)
## Differential expression analysis with DESeq2!## $diff.pie
##
## $up.pie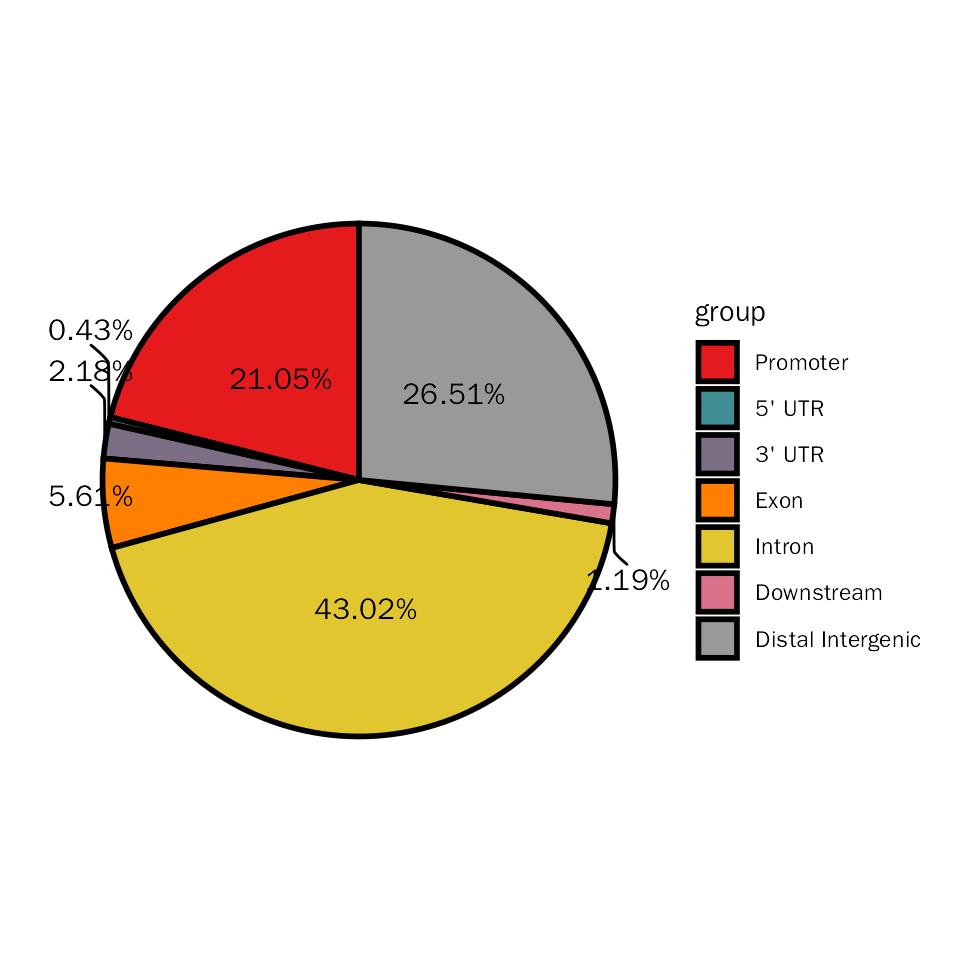
##
## $down.pie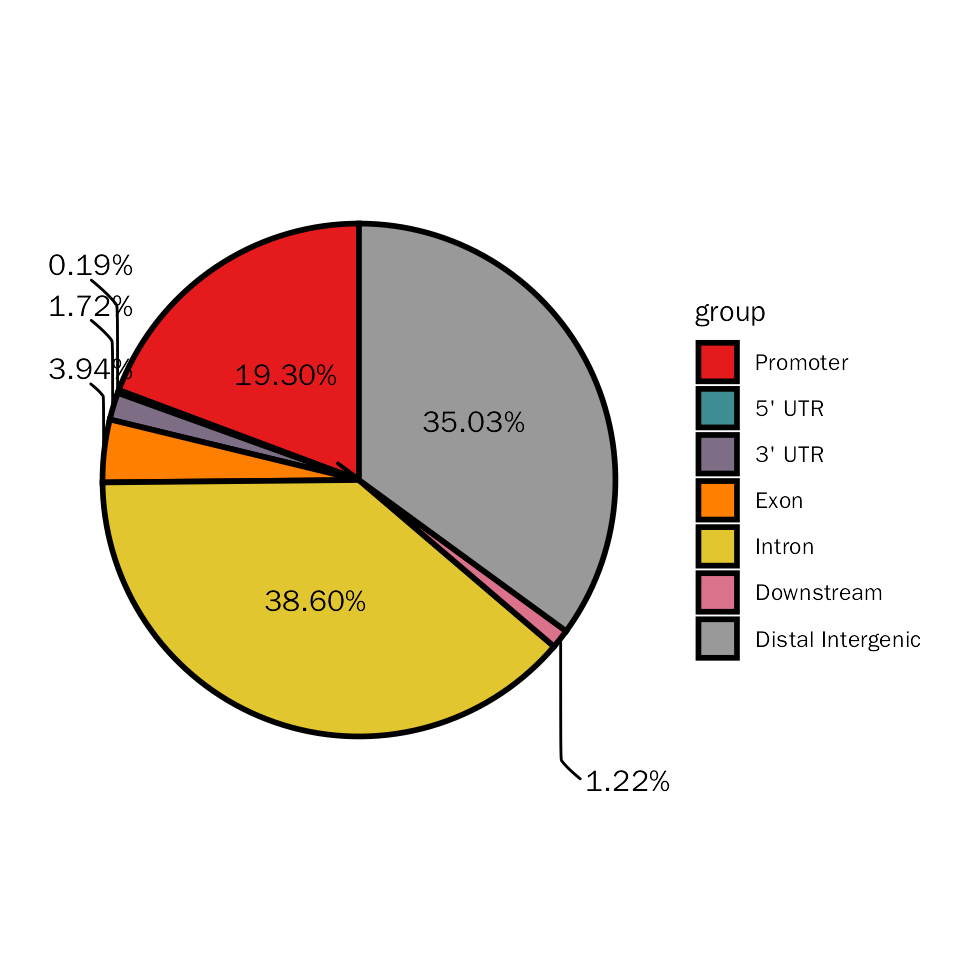
# pie plot for edgeR
DiffPeakPie(deres = all.res, signif="PValue", l2fc.threshold=0.3)
## Differential expression analysis with edgeR!## $diff.pie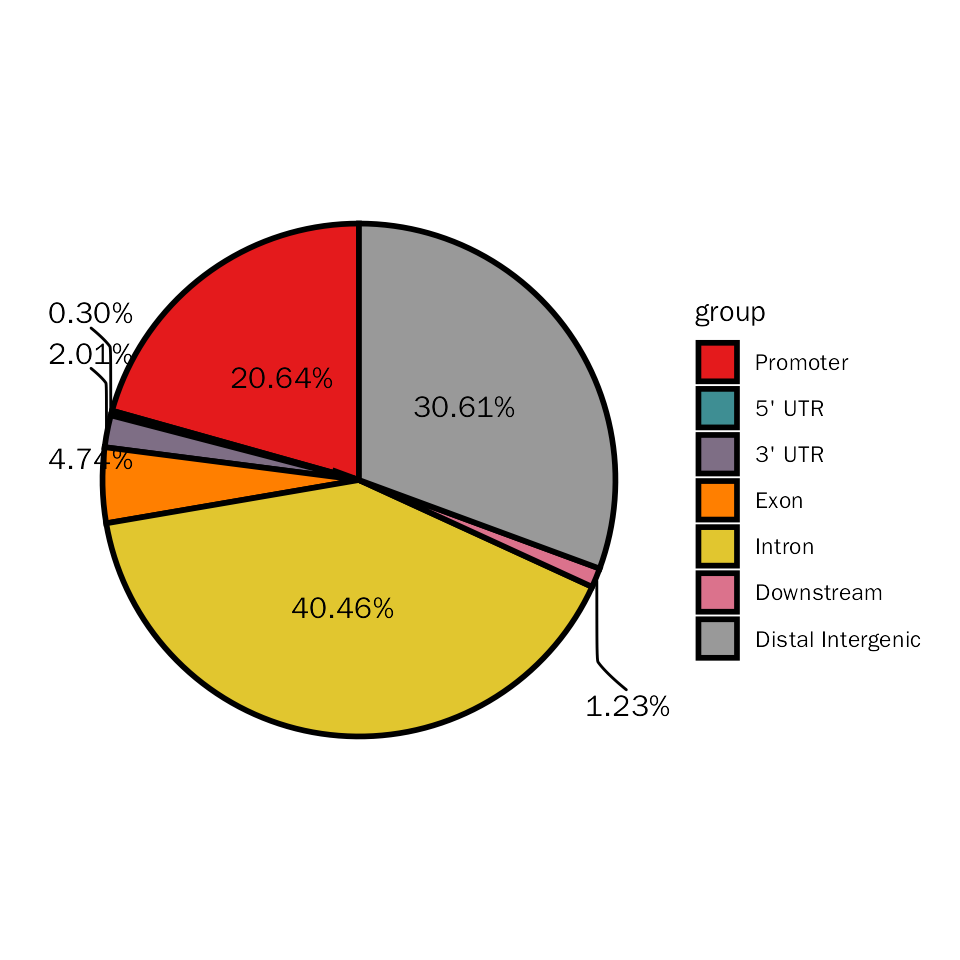
##
## $up.pie
##
## $down.pie
Visualization
VolcanoPlot
# VolcanoPlot for DESeq2
VolcanoPlot(dds.atac.results.ordered,signif="pvalue",l2fc.threshold=0.3,label.num=2,
            point.alpha = 0.8, label.color=c("purple","green"),tick.trans = NULL)
## Differential expression analysis with DESeq2!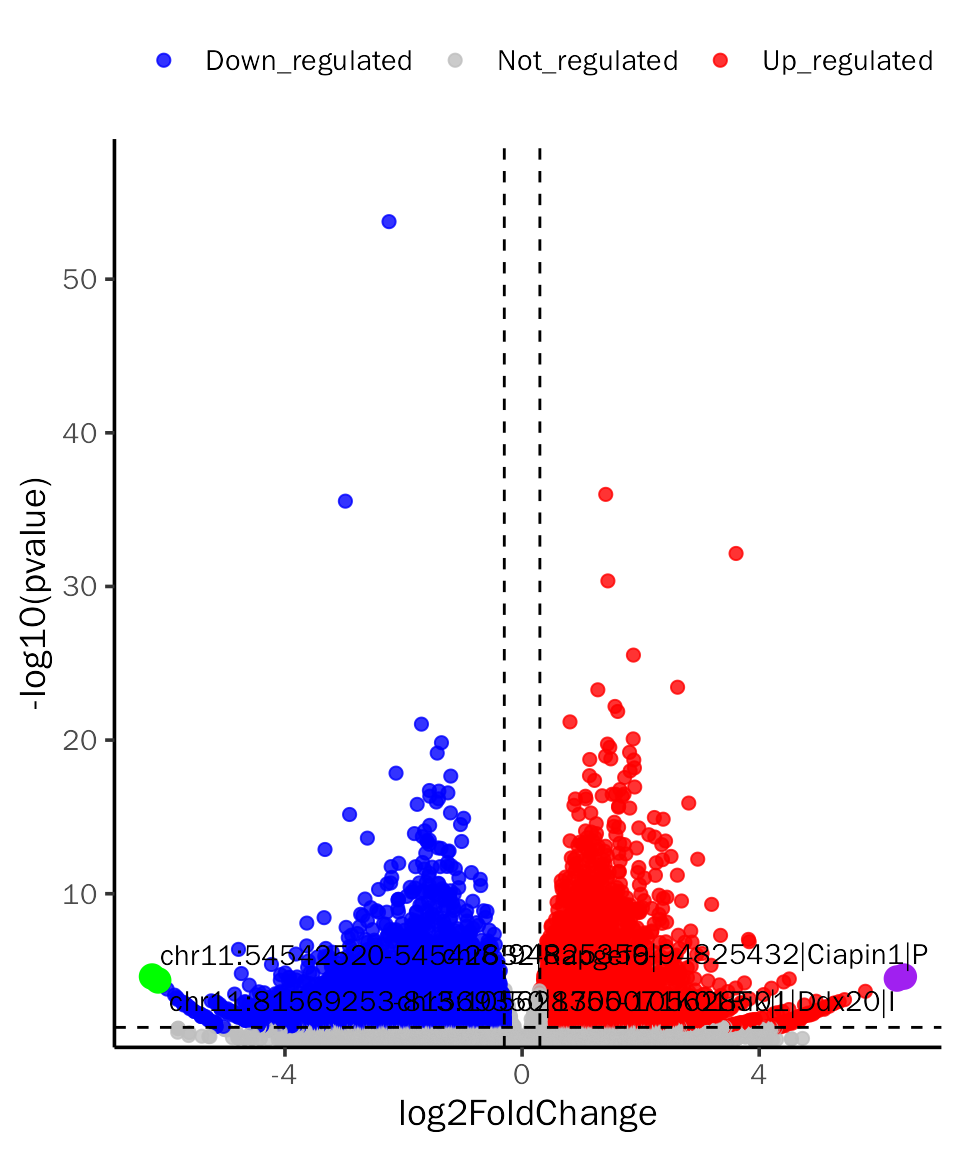
# VolcanoPlot for edgeR
VolcanoPlot(all.res,signif="PValue",l2fc.threshold=0.3,label.num=2,point.alpha = 0.8,
            label.color=c("purple","green"),tick.trans = NULL)
## Differential expression analysis with edgeR!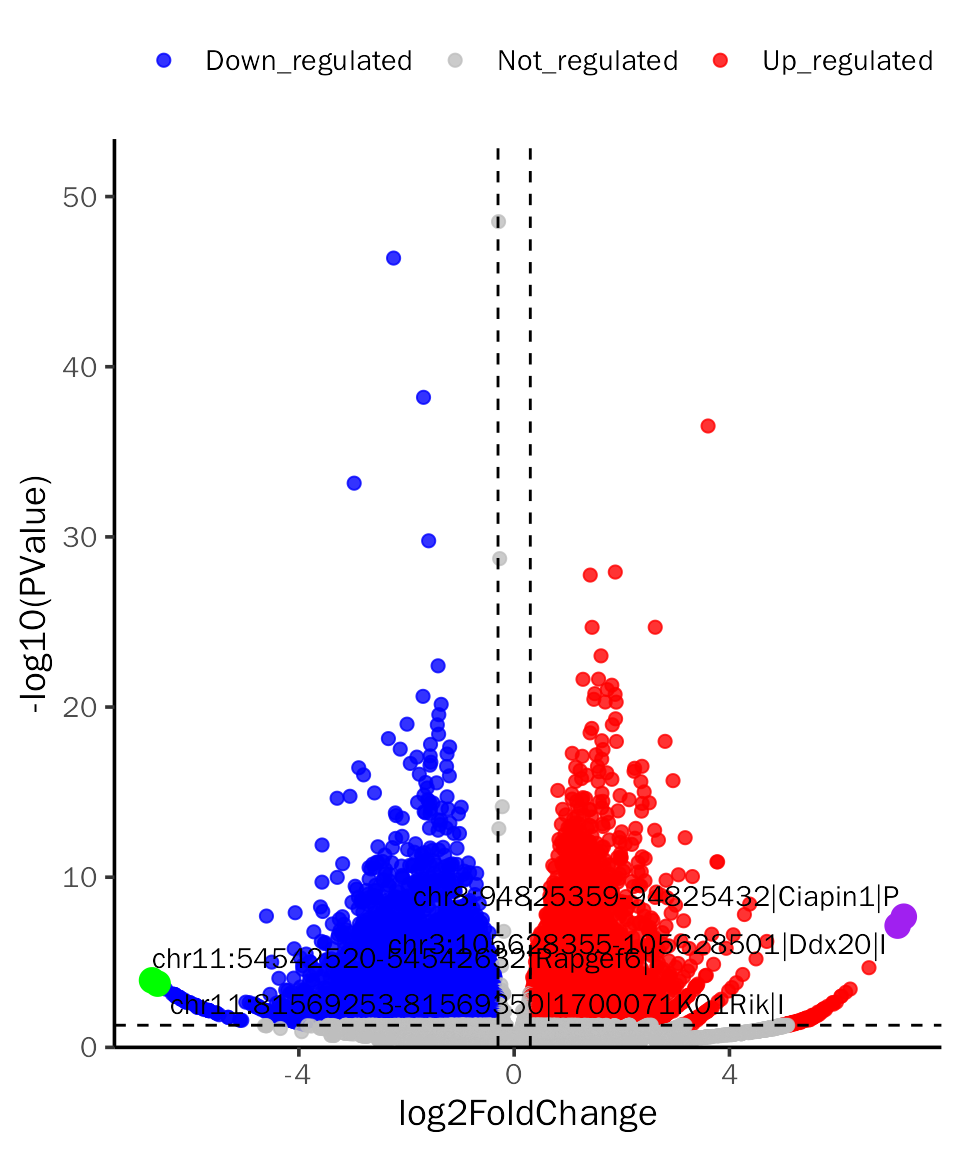
ScatterPlot
# ScatterPlot for DESeq2
ScatterPlot(deobj = dds.atac,deres = dds.atac.results.ordered,group.key = "condition",
            ref.group = "WT",signif="pvalue",l2fc.threshold=0.3,label.num = 2,
            point.alpha = 0.8,label.color=c("purple","green"))
## Differential expression analysis with DESeq2!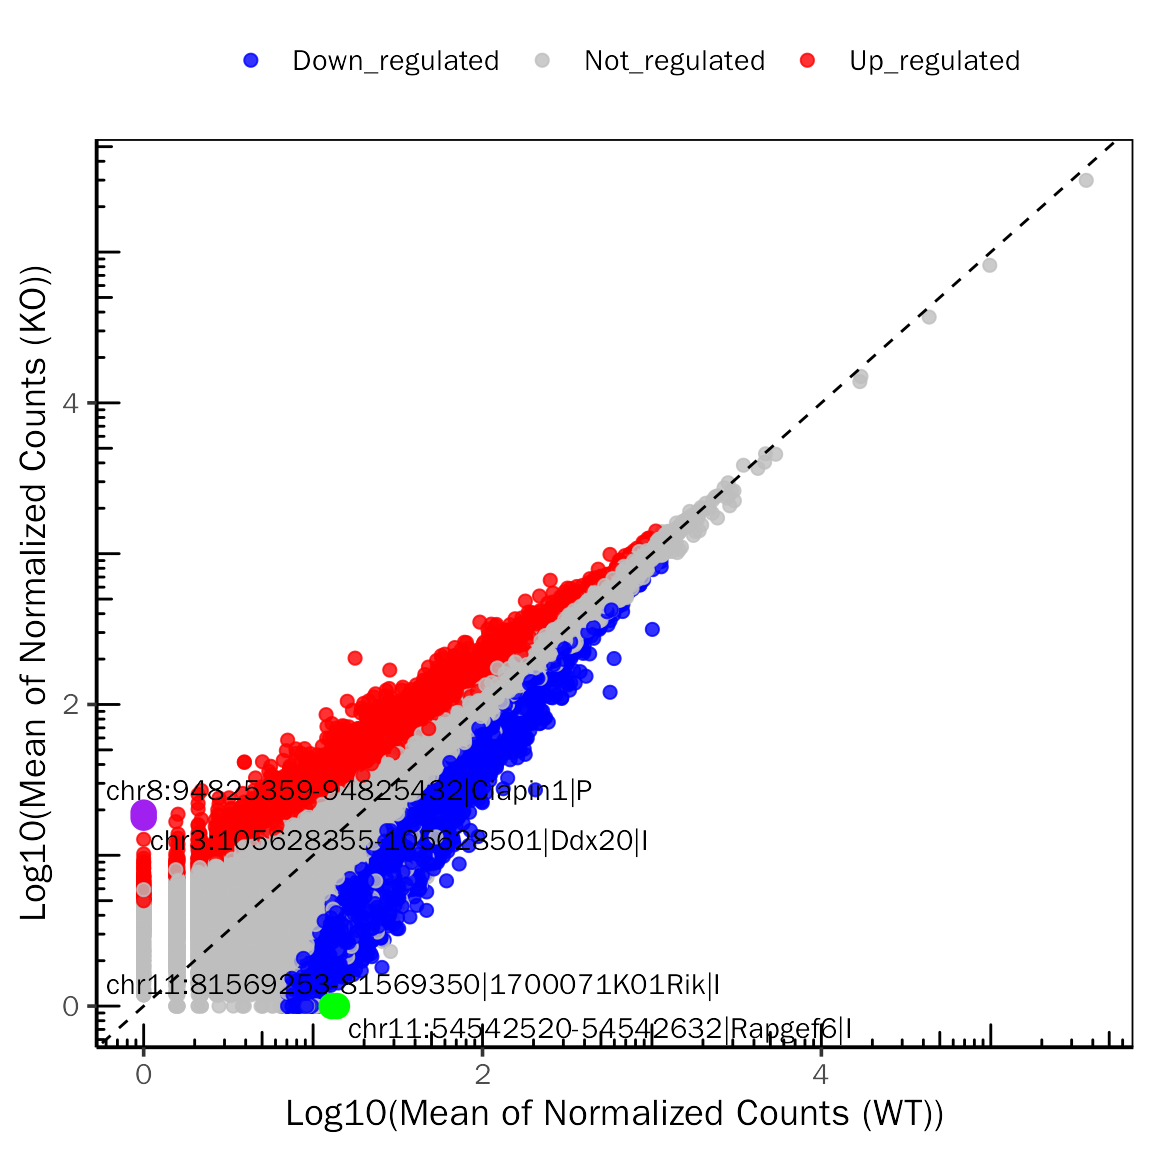
# ScatterPlot for edgeR
ScatterPlot(deobj = atac.edgeR,deres = all.res,group.key = "condition",
            ref.group = "WT",signif="PValue",l2fc.threshold=0.3,label.num = 2,
            point.alpha = 0.8,label.color=c("purple","green"))
## Differential expression analysis with edgeR!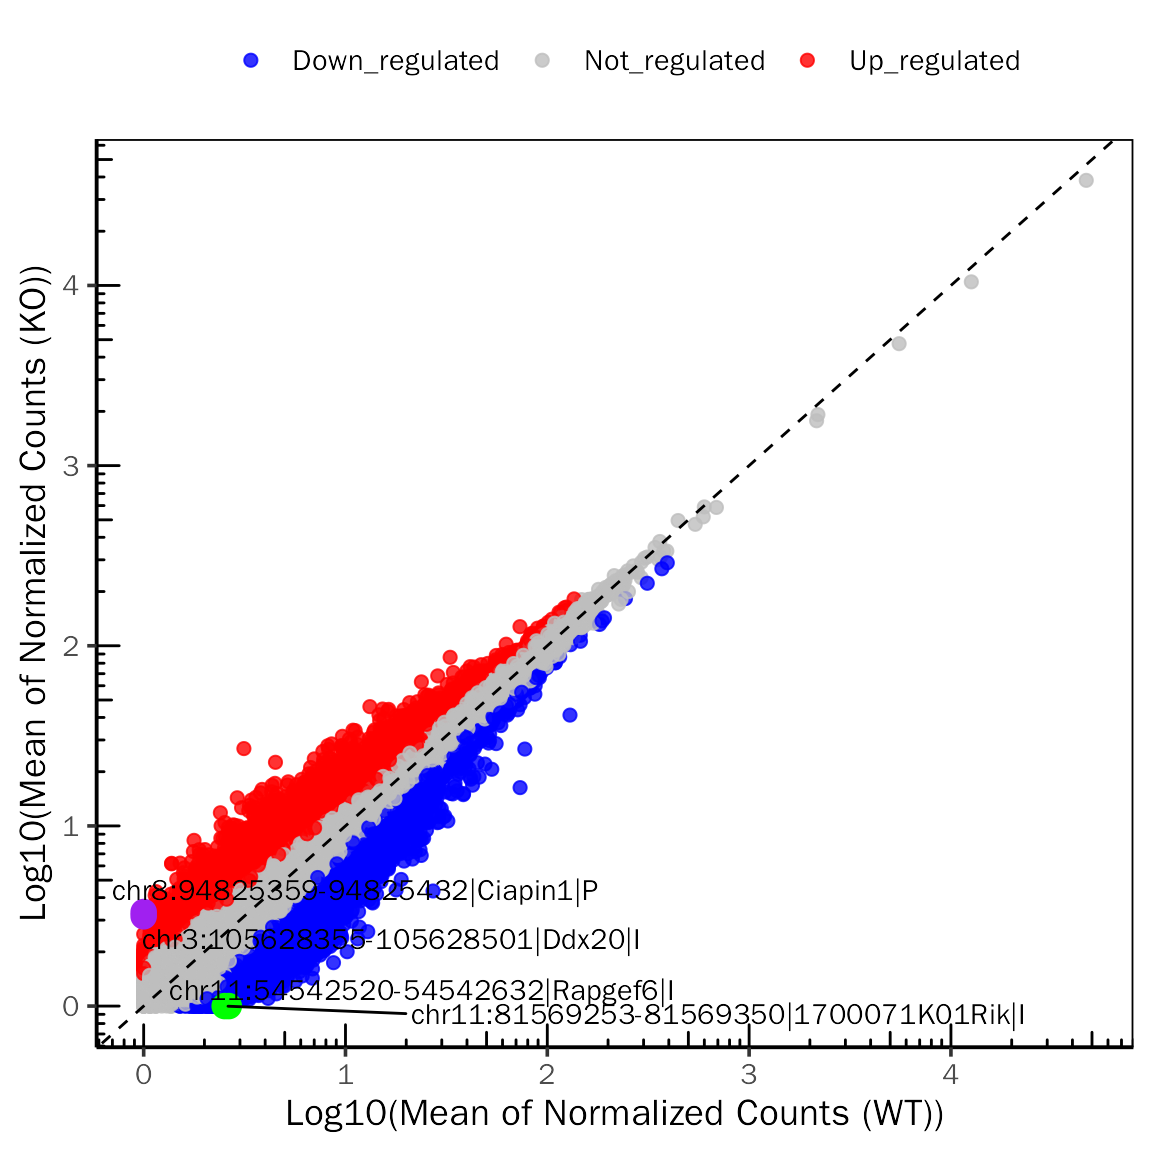
MAPlot
# MAPlot for DESeq2
MAPlot(dds.atac.results.ordered,signif="pvalue",l2fc.threshold=0.3,label.num=2,
       point.alpha = 0.8, label.color=c("purple","green"))
## Differential expression analysis with DESeq2!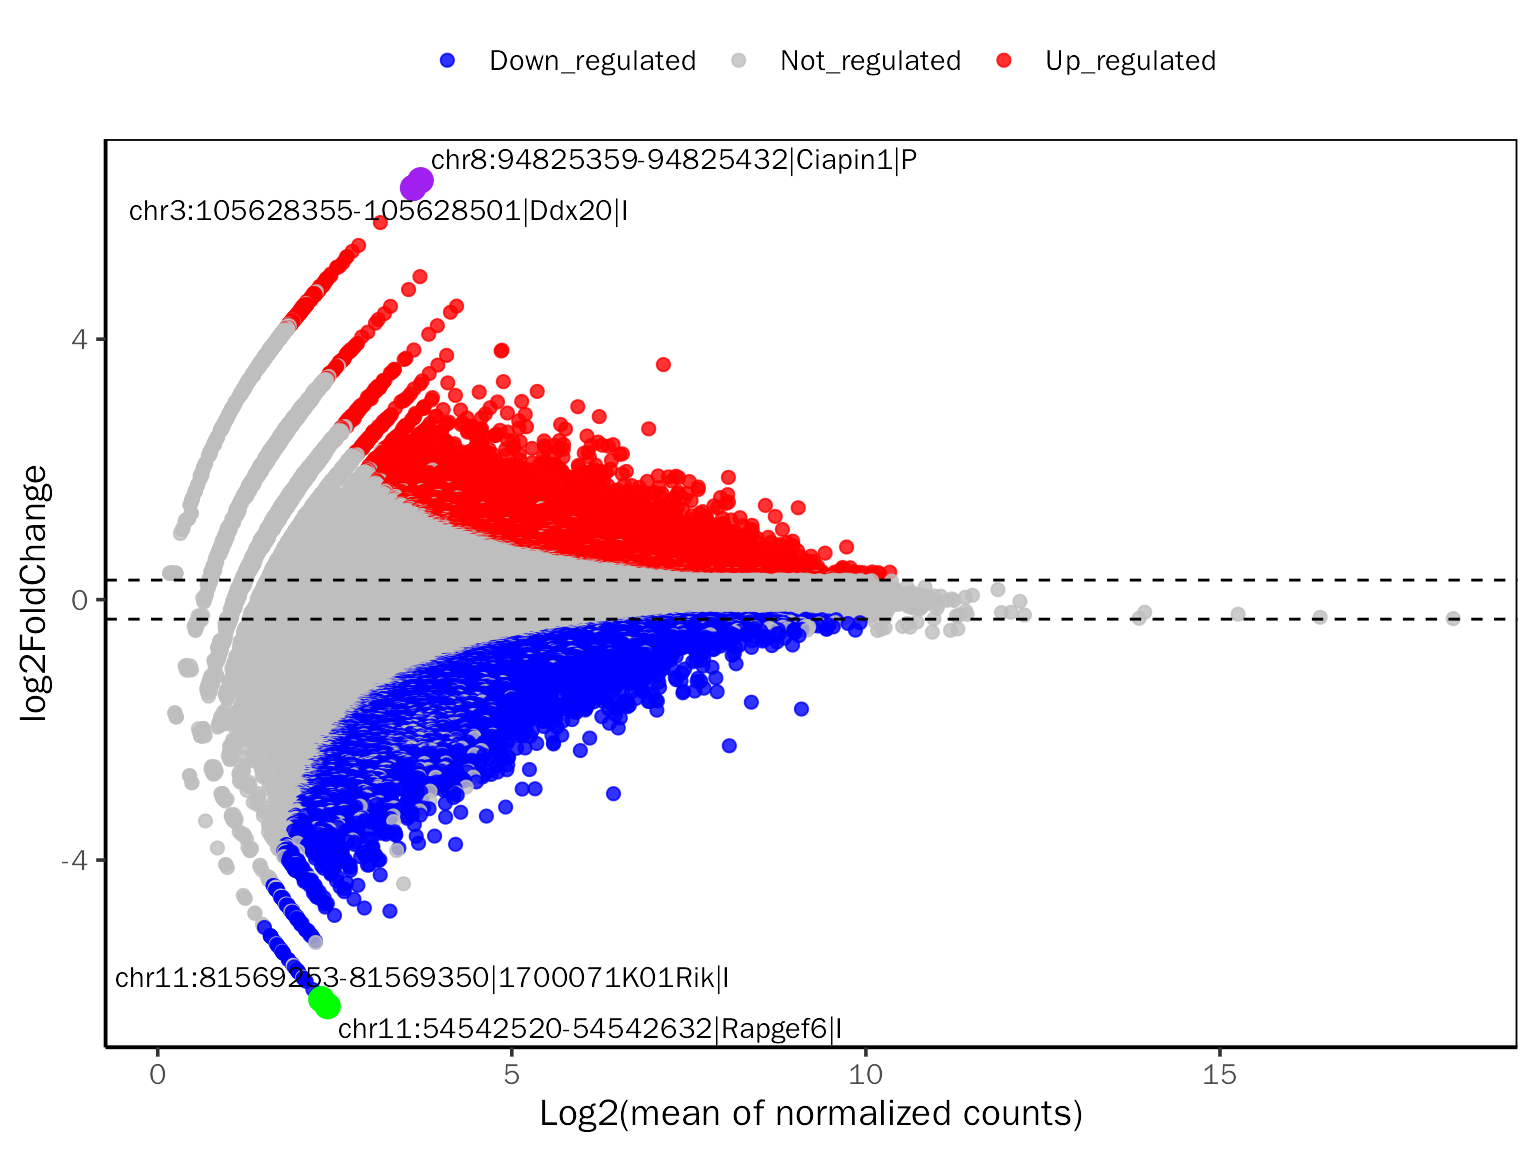
# MAPlot for edgeR
MAPlot(all.res,signif="PValue",l2fc.threshold=0.3,label.num=2,point.alpha = 0.8,
       label.color=c("purple","green"))
## Differential expression analysis with edgeR!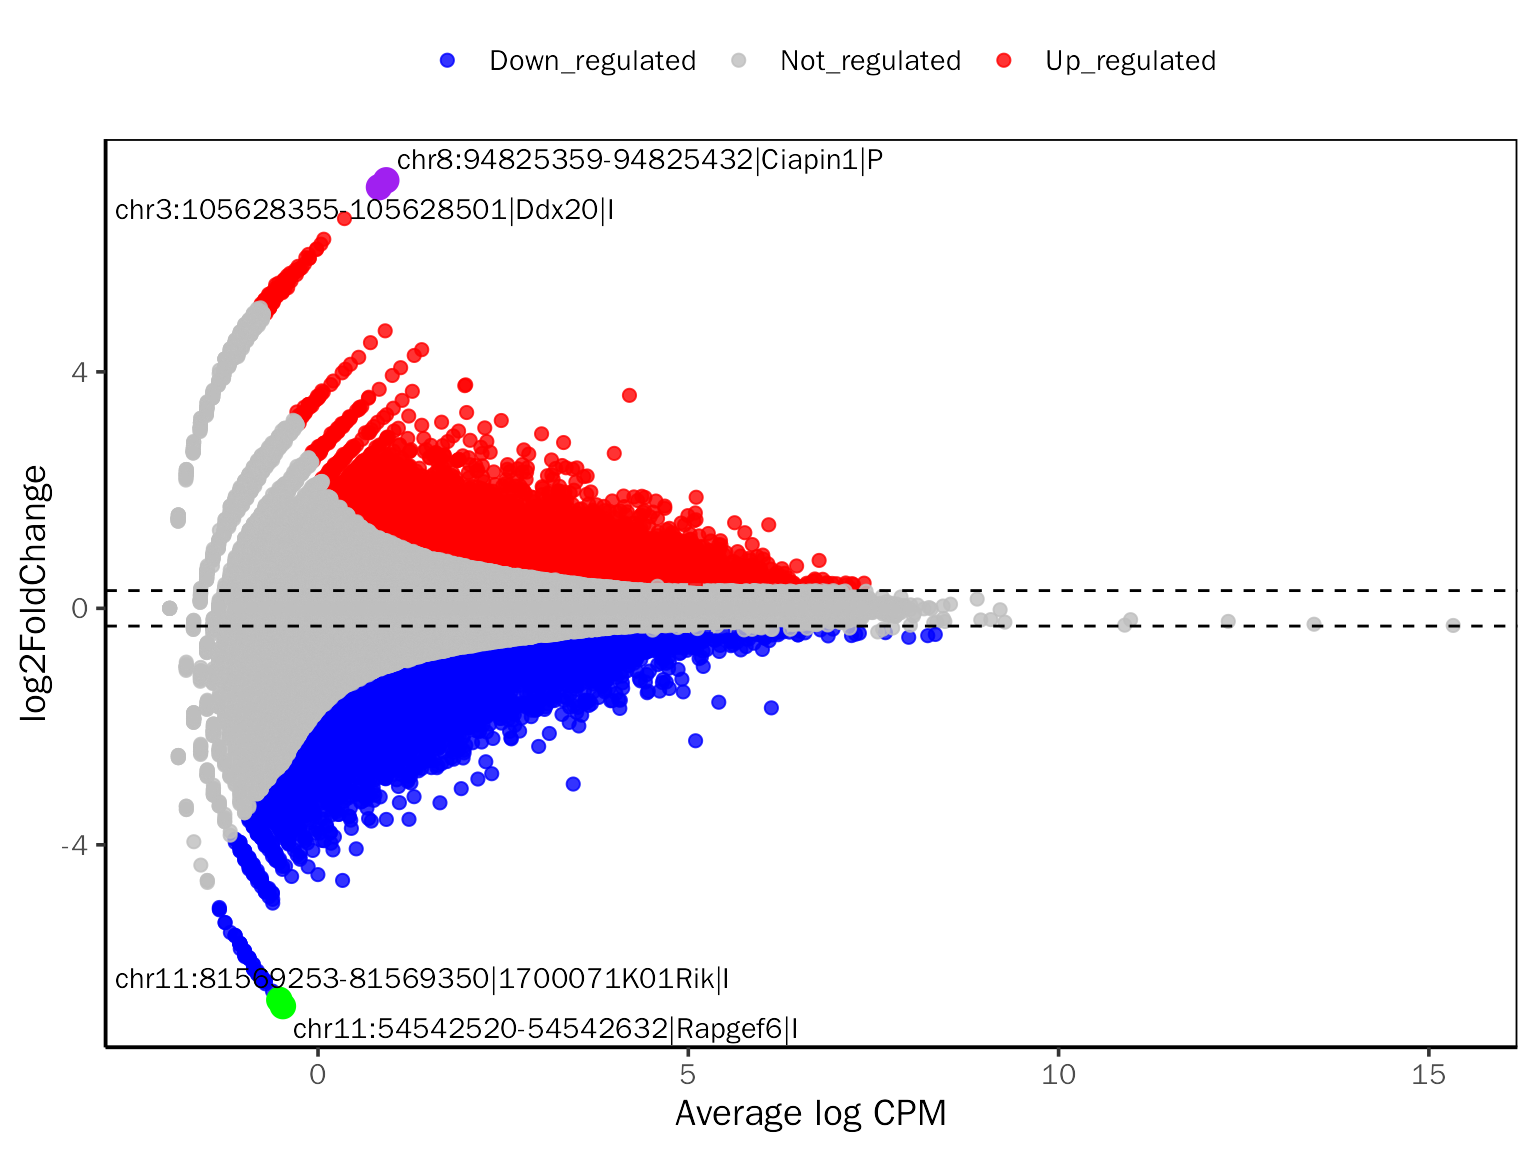
RankPlot
# RankPlot for DESeq2
RankPlot(dds.atac.results.ordered,signif="pvalue",l2fc.threshold=0.3,label.num=2,
         point.alpha = 0.8, label.color=c("purple","green"))
## Differential expression analysis with DESeq2!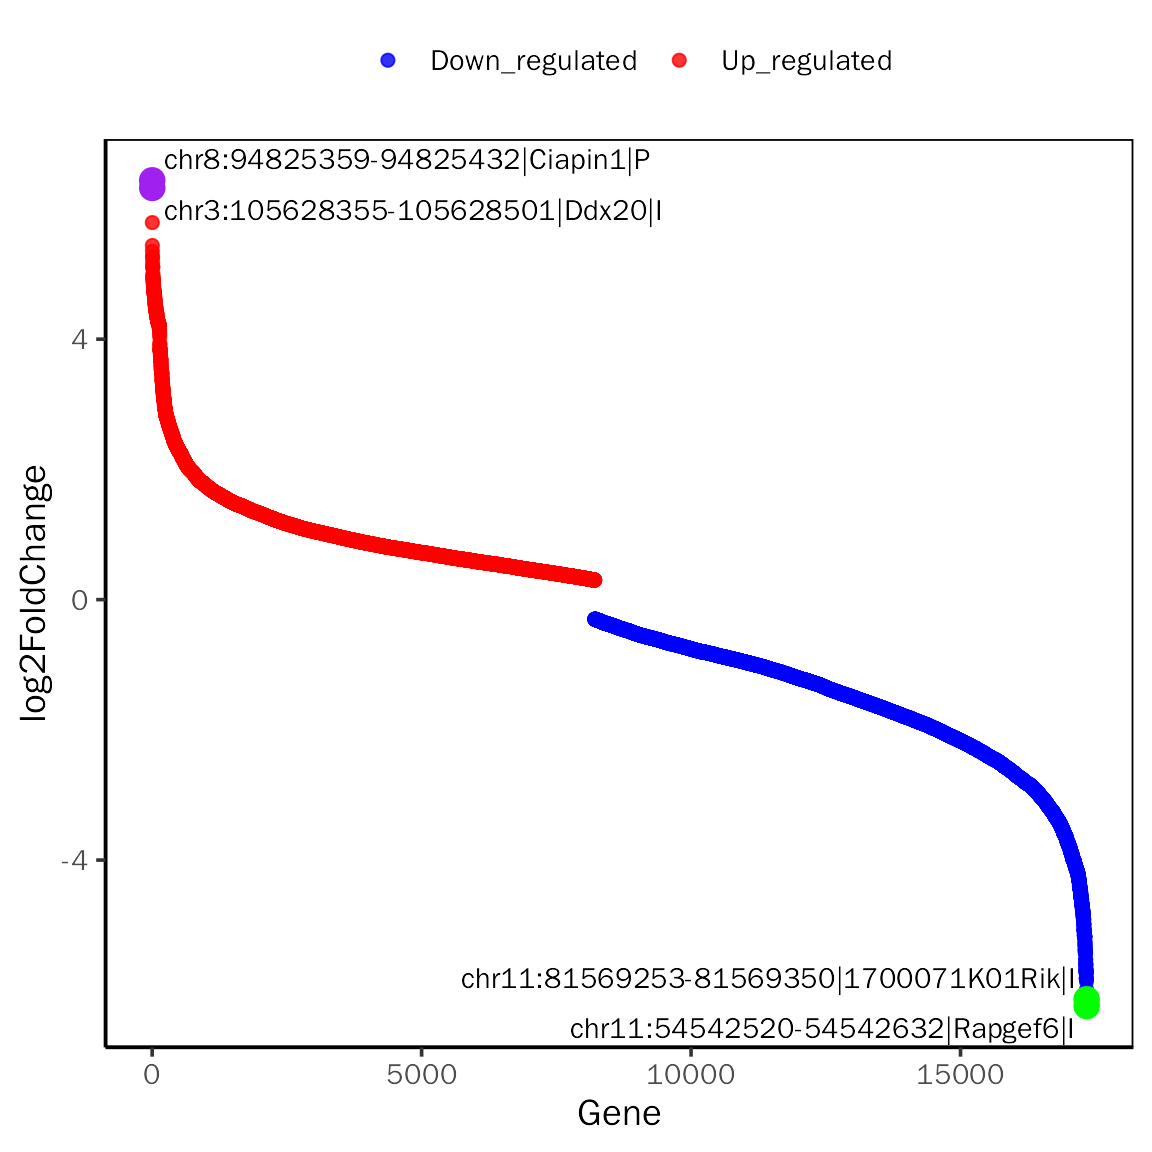
# RankPlot for edgeR
RankPlot(all.res,signif="PValue",l2fc.threshold=0.3,label.num=2,point.alpha = 0.8,
         label.color=c("purple","green"))
## Differential expression analysis with edgeR!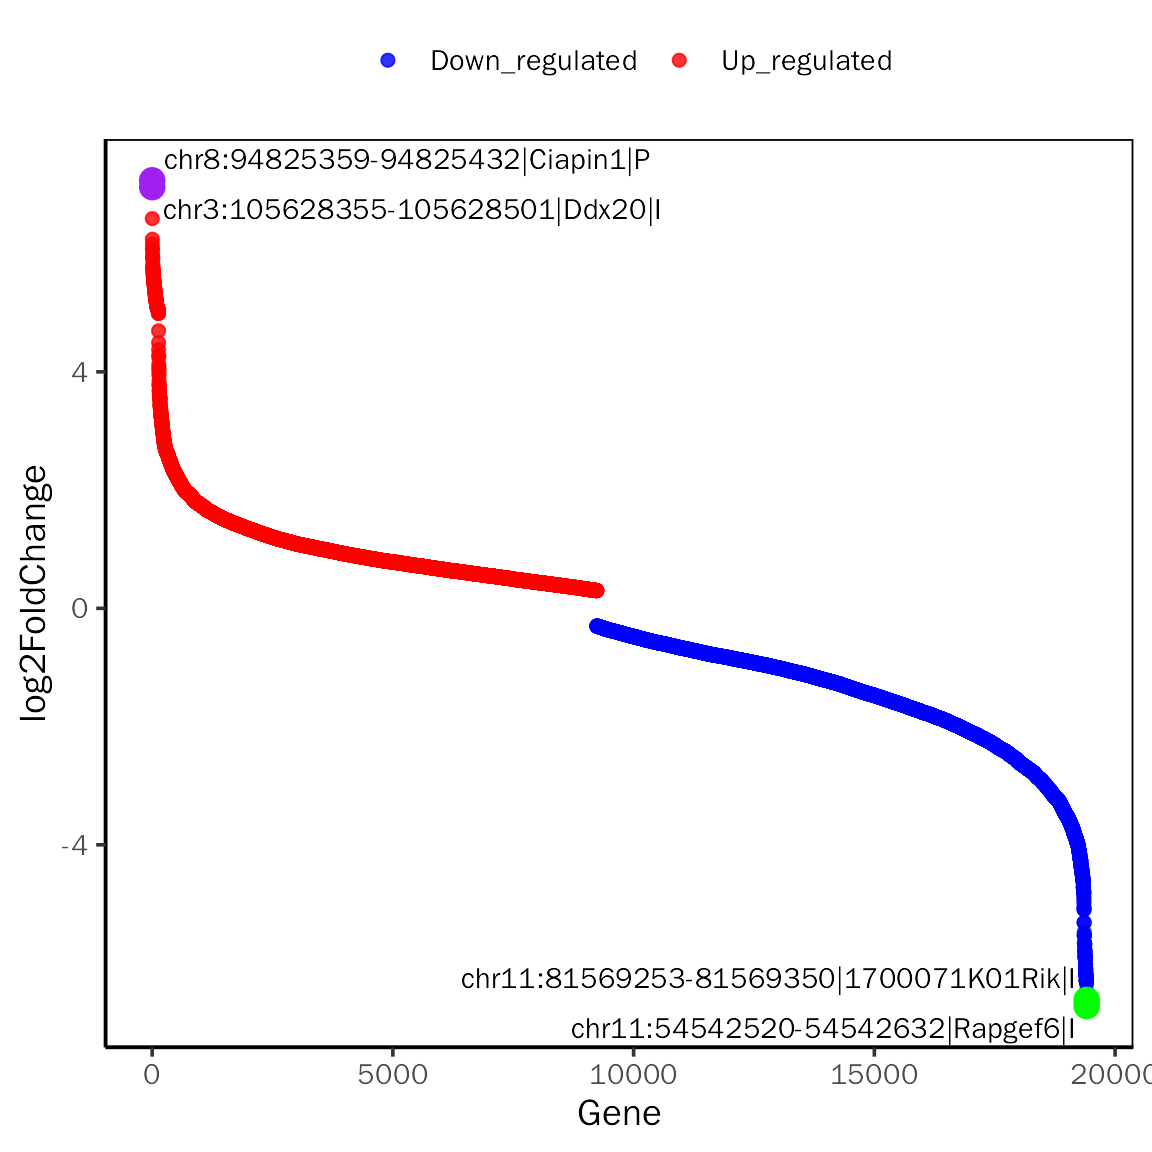
GenePlot
# GenePlot for DESeq2
GenePlot(deobj = dds.atac,deres = dds.atac.results.ordered,group.key = "condition",
         ref.group = "WT",fill.color=c("red","blue"), fill.alpha = 0.8,
         gene.num =2,signif="pvalue",l2fc.threshold=0.3)
## Differential expression analysis with DESeq2!
# GenePlot for edgeR
GenePlot(deobj = atac.edgeR,deres = all.res,group.key = "condition",
         ref.group = "WT",fill.color=c("red","blue"),fill.alpha = 0.8,
         gene.num =2,signif="PValue",l2fc.threshold=0.3)
## Differential expression analysis with edgeR!
DEHeatmap
# DEHeatmap for DESeq2
DEHeatmap(deobj = dds.atac,deres = dds.atac.results.ordered,group.key = "condition",
          ref.group = "WT", signif="pvalue",l2fc.threshold=0.3)
## Differential expression analysis with DESeq2!
# DEHeatmap for edgeR
DEHeatmap(deobj = atac.edgeR,deres = all.res,group.key = "condition",
          ref.group = "WT", signif="PValue",l2fc.threshold=0.3)
## Differential expression analysis with edgeR!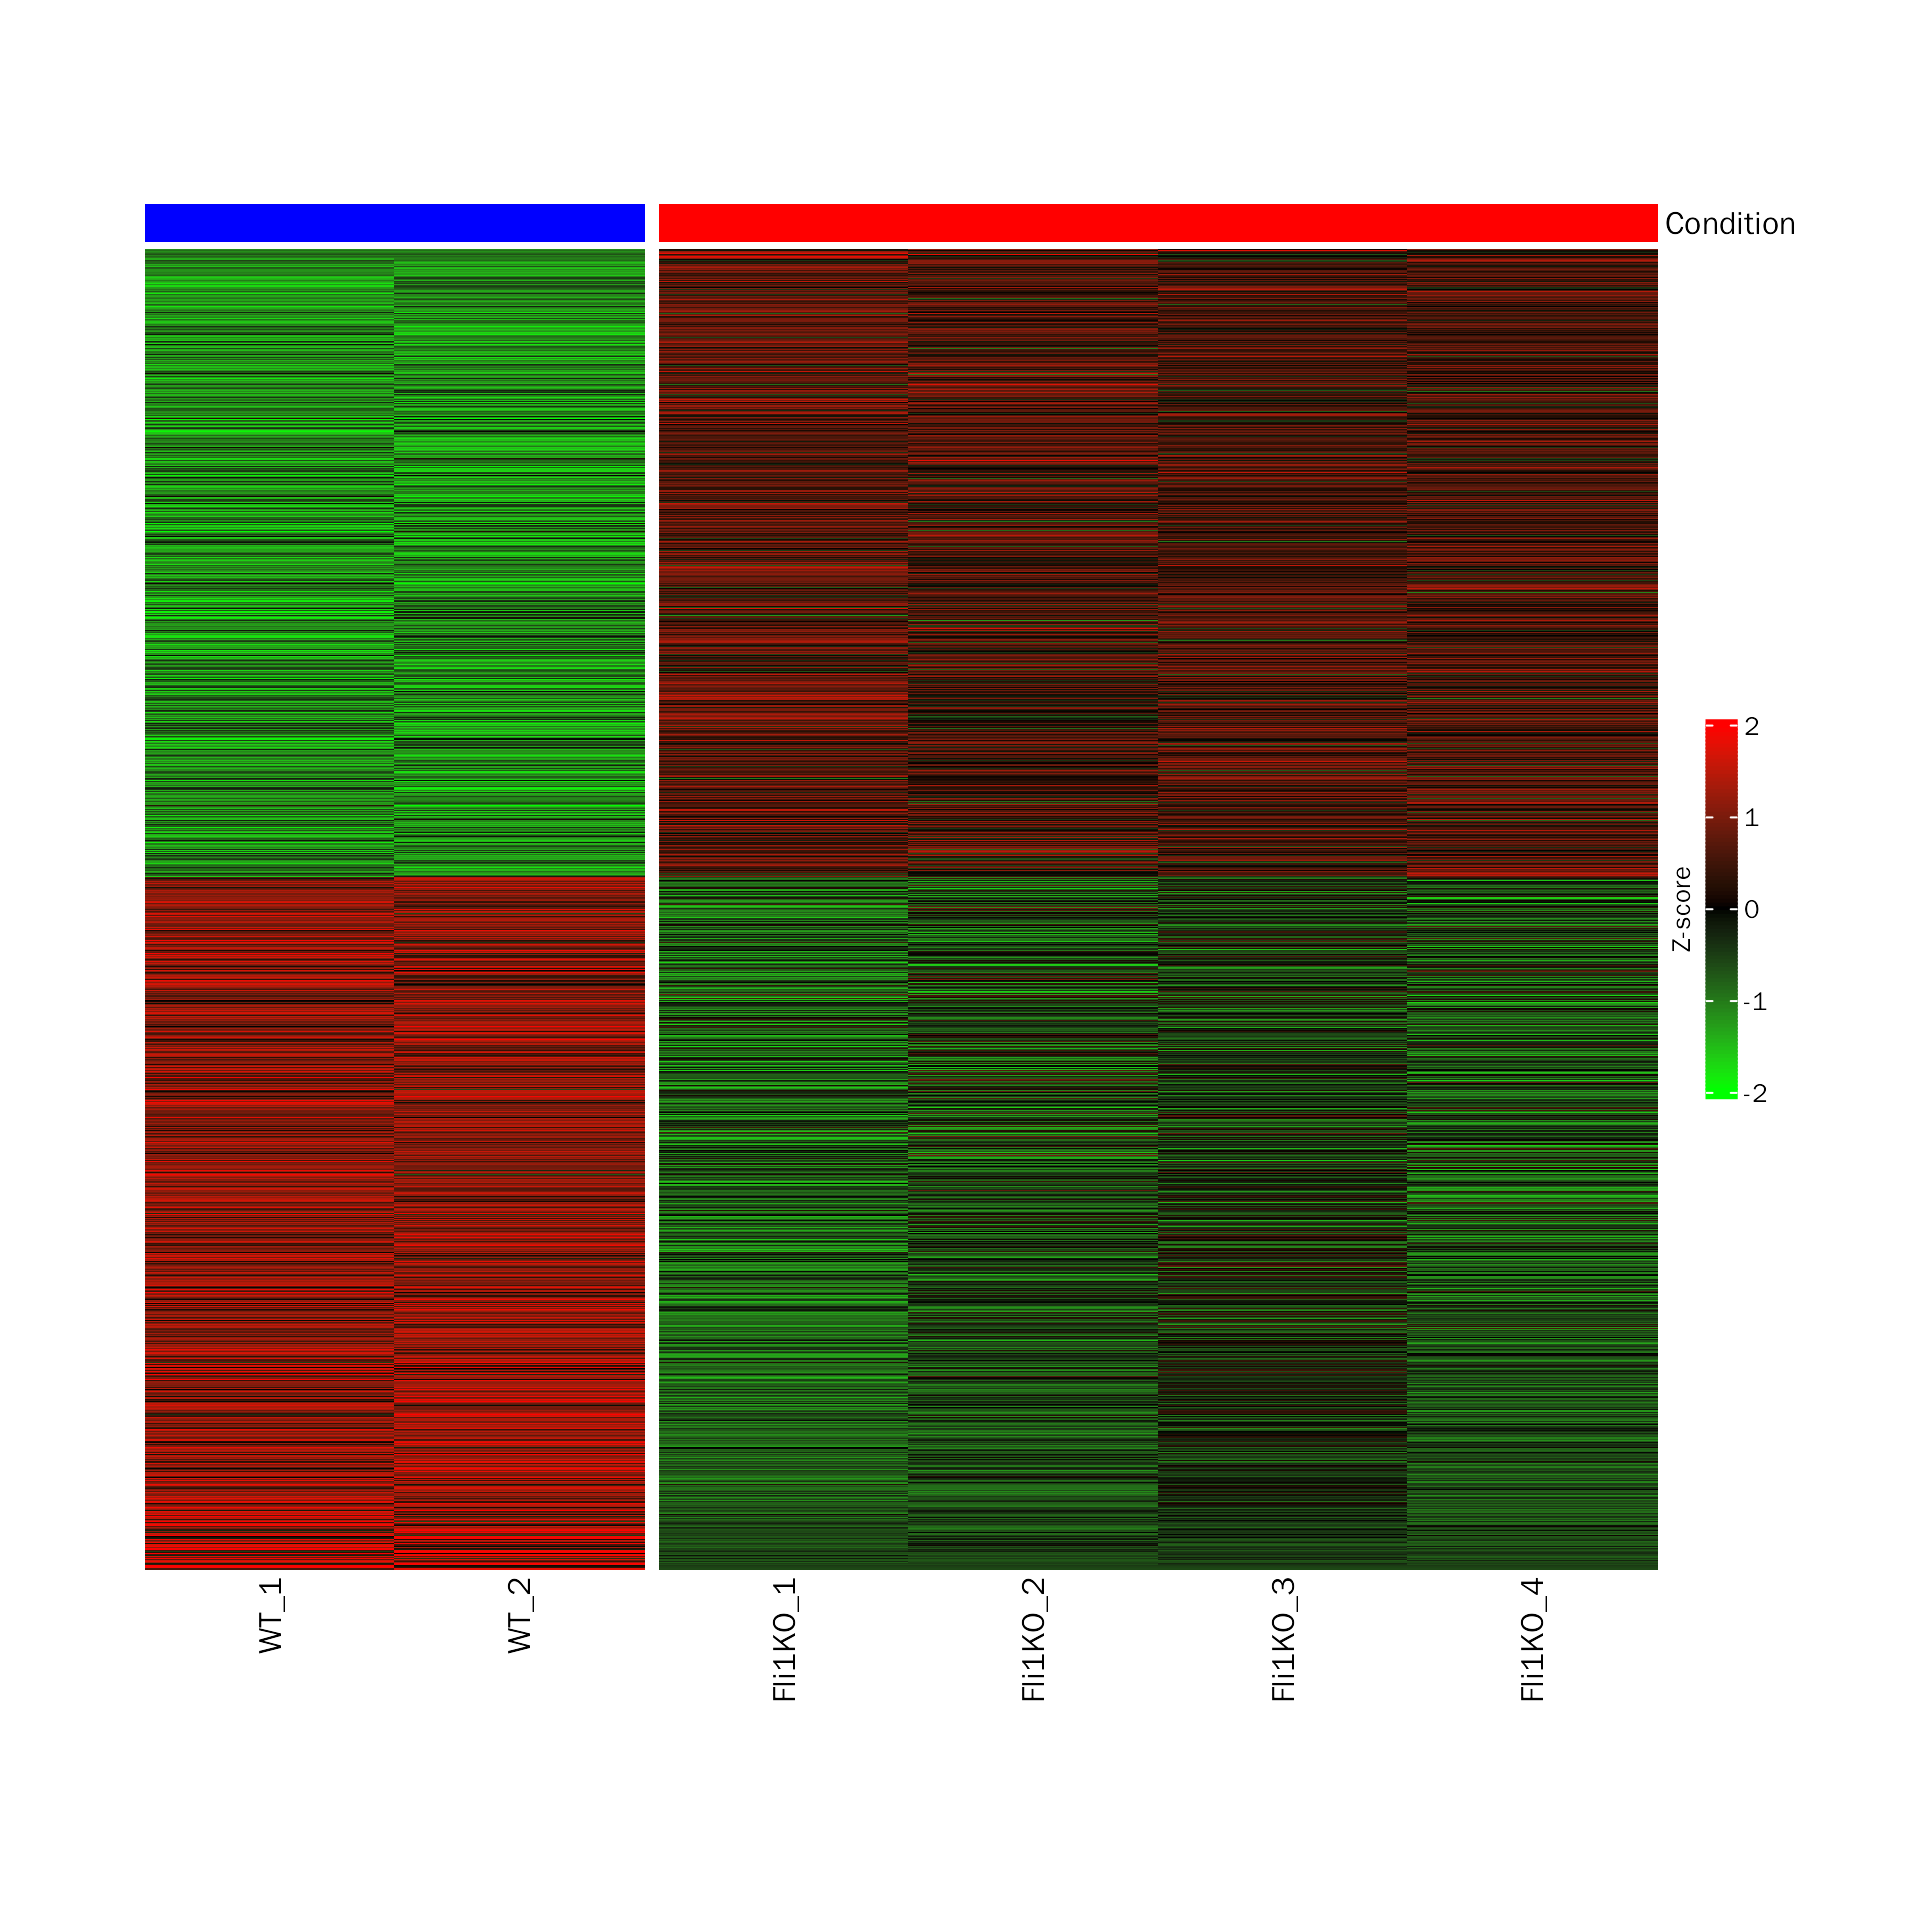
Session info
## R version 4.0.3 (2020-10-10)
## Platform: x86_64-conda-linux-gnu (64-bit)
## Running under: CentOS Linux 7 (Core)
##
## Matrix products: default
## BLAS/LAPACK: /home/softwares/anaconda3/envs/r4.0/lib/libopenblasp-r0.3.12.so
##
## locale:
##  [1] LC_CTYPE=zh_CN.UTF-8       LC_NUMERIC=C
##  [3] LC_TIME=zh_CN.UTF-8        LC_COLLATE=zh_CN.UTF-8
##  [5] LC_MONETARY=zh_CN.UTF-8    LC_MESSAGES=zh_CN.UTF-8
##  [7] LC_PAPER=zh_CN.UTF-8       LC_NAME=C
##  [9] LC_ADDRESS=C               LC_TELEPHONE=C
## [11] LC_MEASUREMENT=zh_CN.UTF-8 LC_IDENTIFICATION=C
##
## attached base packages:
## [1] stats4    stats     graphics  grDevices utils     datasets  methods
## [8] base
##
## other attached packages:
##  [1] DEbPeak_1.4.0               edgeR_3.32.1
##  [3] limma_3.46.0                DESeq2_1.30.1
##  [5] SummarizedExperiment_1.20.0 Biobase_2.50.0
##  [7] MatrixGenerics_1.2.1        matrixStats_0.58.0
##  [9] GenomicRanges_1.42.0        GenomeInfoDb_1.26.7
## [11] IRanges_2.24.1              S4Vectors_0.28.1
## [13] BiocGenerics_0.42.0
##
## loaded via a namespace (and not attached):
##   [1] rsvd_1.0.3
##   [2] ggvenn_0.1.9
##   [3] apeglm_1.12.0
##   [4] Rsamtools_2.6.0
##   [5] rsvg_2.1
##   [6] foreach_1.5.1
##   [7] rprojroot_2.0.2
##   [8] crayon_1.4.1
##   [9] V8_3.4.2
##  [10] MASS_7.3-58
##  [11] nlme_3.1-152
##  [12] backports_1.2.1
##  [13] sva_3.38.0
##  [14] GOSemSim_2.25.0
##  [15] rlang_1.1.0
##  [16] XVector_0.30.0
##  [17] readxl_1.4.2
##  [18] irlba_2.3.5
##  [19] GOstats_2.56.0
##  [20] BiocParallel_1.24.1
##  [21] rjson_0.2.20
##  [22] bit64_4.0.5
##  [23] glue_1.6.2
##  [24] DiffBind_3.0.15
##  [25] mixsqp_0.3-43
##  [26] pheatmap_1.0.12
##  [27] parallel_4.0.3
##  [28] AnnotationDbi_1.52.0
##  [29] DEFormats_1.18.0
##  [30] base64url_1.4
##  [31] tcltk_4.0.3
##  [32] DOSE_3.23.2
##  [33] haven_2.5.2
##  [34] tidyselect_1.2.0
##  [35] rio_0.5.27
##  [36] XML_3.99-0.6
##  [37] tidyr_1.3.0
##  [38] ggpubr_0.4.0
##  [39] GenomicAlignments_1.26.0
##  [40] xtable_1.8-4
##  [41] ggnetwork_0.5.12
##  [42] magrittr_2.0.3
##  [43] evaluate_0.14
##  [44] ggplot2_3.4.2
##  [45] cli_3.6.1
##  [46] zlibbioc_1.36.0
##  [47] hwriter_1.3.2
##  [48] rstudioapi_0.14
##  [49] bslib_0.3.1
##  [50] GreyListChIP_1.22.0
##  [51] fastmatch_1.1-3
##  [52] BiocSingular_1.6.0
##  [53] xfun_0.30
##  [54] askpass_1.1
##  [55] clue_0.3-59
##  [56] gson_0.0.9
##  [57] cluster_2.1.1
##  [58] caTools_1.18.2
##  [59] tidygraph_1.2.0
##  [60] tibble_3.2.1
##  [61] ggrepel_0.9.1
##  [62] Biostrings_2.58.0
##  [63] png_0.1-7
##  [64] withr_2.5.0
##  [65] bitops_1.0-6
##  [66] ggforce_0.3.3
##  [67] RBGL_1.66.0
##  [68] plyr_1.8.6
##  [69] cellranger_1.1.0
##  [70] GSEABase_1.52.1
##  [71] pcaPP_2.0-1
##  [72] dqrng_0.2.1
##  [73] coda_0.19-4
##  [74] pillar_1.9.0
##  [75] gplots_3.1.1
##  [76] GlobalOptions_0.1.2
##  [77] cachem_1.0.4
##  [78] GenomicFeatures_1.42.2
##  [79] fs_1.5.0
##  [80] GetoptLong_1.0.5
##  [81] clusterProfiler_4.7.1
##  [82] DelayedMatrixStats_1.12.3
##  [83] vctrs_0.6.2
##  [84] generics_0.1.0
##  [85] plot3D_1.4
##  [86] tools_4.0.3
##  [87] foreign_0.8-81
##  [88] NOISeq_2.34.0
##  [89] munsell_0.5.0
##  [90] tweenr_1.0.2
##  [91] fgsea_1.16.0
##  [92] DelayedArray_0.16.3
##  [93] fastmap_1.1.0
##  [94] compiler_4.0.3
##  [95] abind_1.4-5
##  [96] rtracklayer_1.50.0
##  [97] TxDb.Hsapiens.UCSC.hg19.knownGene_3.2.2
##  [98] GenomeInfoDbData_1.2.4
##  [99] gridExtra_2.3
## [100] lattice_0.20-45
## [101] ggnewscale_0.4.7
## [102] AnnotationForge_1.32.0
## [103] utf8_1.2.1
## [104] dplyr_1.1.2
## [105] BiocFileCache_1.14.0
## [106] jsonlite_1.8.4
## [107] scales_1.2.1
## [108] graph_1.68.0
## [109] carData_3.0-4
## [110] sparseMatrixStats_1.2.1
## [111] TFEA.ChIP_1.10.0
## [112] genefilter_1.72.1
## [113] car_3.0-11
## [114] doParallel_1.0.16
## [115] latticeExtra_0.6-29
## [116] R.utils_2.12.0
## [117] brew_1.0-6
## [118] checkmate_2.0.0
## [119] rmarkdown_2.14
## [120] openxlsx_4.2.3
## [121] pkgdown_1.6.1
## [122] cowplot_1.1.1
## [123] textshaping_0.3.6
## [124] forcats_1.0.0
## [125] downloader_0.4
## [126] BSgenome_1.58.0
## [127] igraph_1.4.99.9024
## [128] survival_3.2-10
## [129] numDeriv_2016.8-1.1
## [130] yaml_2.2.1
## [131] plotrix_3.8-2
## [132] systemfonts_1.0.4
## [133] ashr_2.2-47
## [134] SQUAREM_2021.1
## [135] htmltools_0.5.2
## [136] memoise_2.0.0
## [137] VariantAnnotation_1.36.0
## [138] locfit_1.5-9.4
## [139] graphlayouts_0.7.1
## [140] batchtools_0.9.15
## [141] PCAtools_2.2.0
## [142] viridisLite_0.4.0
## [143] rrcov_1.7-0
## [144] digest_0.6.27
## [145] assertthat_0.2.1
## [146] rappdirs_0.3.3
## [147] emdbook_1.3.12
## [148] RSQLite_2.2.5
## [149] amap_0.8-18
## [150] yulab.utils_0.0.4
## [151] debugme_1.1.0
## [152] misc3d_0.9-1
## [153] data.table_1.14.2
## [154] blob_1.2.1
## [155] R.oo_1.24.0
## [156] ragg_0.4.0
## [157] labeling_0.4.2
## [158] splines_4.0.3
## [159] Cairo_1.5-12.2
## [160] ggupset_0.3.0
## [161] RCurl_1.98-1.3
## [162] broom_1.0.4
## [163] hms_1.1.3
## [164] colorspace_2.0-0
## [165] BiocManager_1.30.16
## [166] shape_1.4.6
## [167] sass_0.4.1
## [168] GEOquery_2.58.0
## [169] Rcpp_1.0.9
## [170] mvtnorm_1.1-2
## [171] circlize_0.4.15
## [172] enrichplot_1.10.2
## [173] fansi_0.4.2
## [174] tzdb_0.3.0
## [175] truncnorm_1.0-8
## [176] ChIPseeker_1.33.0.900
## [177] R6_2.5.0
## [178] grid_4.0.3
## [179] lifecycle_1.0.3
## [180] ShortRead_1.48.0
## [181] zip_2.1.1
## [182] curl_4.3
## [183] ggsignif_0.6.3
## [184] jquerylib_0.1.3
## [185] robustbase_0.95-0
## [186] DO.db_2.9
## [187] Matrix_1.5-4
## [188] qvalue_2.22.0
## [189] desc_1.3.0
## [190] org.Hs.eg.db_3.12.0
## [191] RColorBrewer_1.1-2
## [192] iterators_1.0.13
## [193] stringr_1.5.0
## [194] DOT_0.1
## [195] ggpie_0.2.5
## [196] beachmat_2.6.4
## [197] polyclip_1.10-0
## [198] biomaRt_2.46.3
## [199] purrr_1.0.1
## [200] shadowtext_0.0.9
## [201] gridGraphics_0.5-1
## [202] mgcv_1.8-34
## [203] ComplexHeatmap_2.13.1
## [204] openssl_1.4.3
## [205] patchwork_1.0.0
## [206] bdsmatrix_1.3-4
## [207] codetools_0.2-18
## [208] invgamma_1.1
## [209] GO.db_3.12.1
## [210] gtools_3.8.2
## [211] prettyunits_1.1.1
## [212] dbplyr_2.3.2
## [213] R.methodsS3_1.8.1
## [214] gtable_0.3.0
## [215] DBI_1.1.1
## [216] highr_0.8
## [217] ggfun_0.0.6
## [218] httr_1.4.5
## [219] KernSmooth_2.23-18
## [220] stringi_1.5.3
## [221] progress_1.2.2
## [222] reshape2_1.4.4
## [223] farver_2.1.0
## [224] annotate_1.68.0
## [225] viridis_0.6.1
## [226] Rgraphviz_2.34.0
## [227] xml2_1.3.4
## [228] bbmle_1.0.24
## [229] systemPipeR_1.24.3
## [230] boot_1.3-28
## [231] readr_2.1.4
## [232] geneplotter_1.68.0
## [233] ggplotify_0.1.0
## [234] Category_2.56.0
## [235] DEoptimR_1.0-11
## [236] bit_4.0.4
## [237] scatterpie_0.1.7
## [238] jpeg_0.1-8.1
## [239] ggraph_2.0.5
## [240] pkgconfig_2.0.3
## [241] rstatix_0.7.0
## [242] knitr_1.37