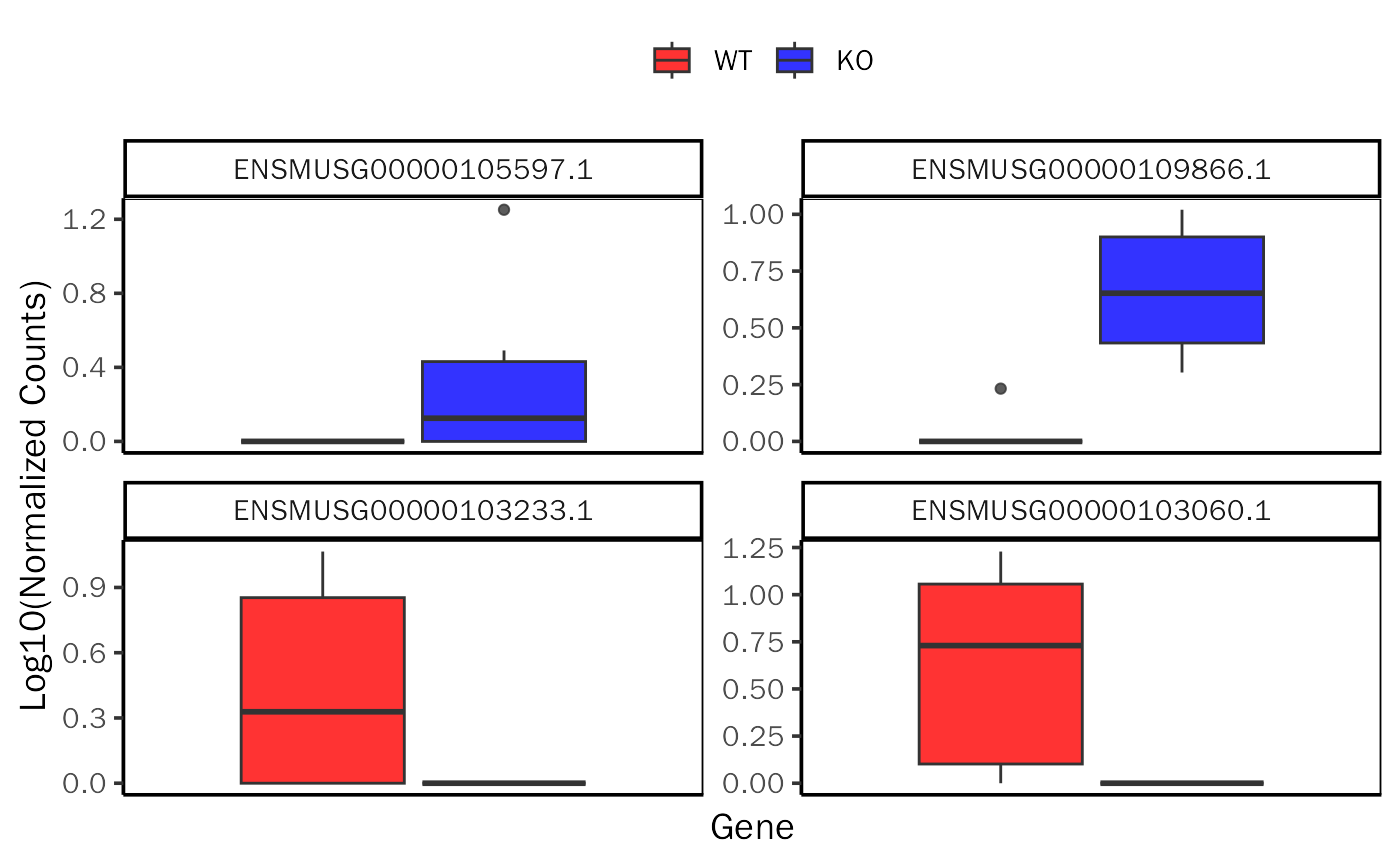
Gene Expresion or Peak Accessibility/Binding Plot.
GenePlot.RdGene Expresion or Peak Accessibility/Binding Plot.
GenePlot(
  deobj,
  deres,
  group.key = NULL,
  ref.group = NULL,
  base = 10,
  fill.color = c("blue", "red"),
  fill.alpha = 0.6,
  gene.df = NULL,
  label.key = NULL,
  gene.num = 2,
  plot.col = 2,
  scales = "free",
  signif = "padj",
  signif.threshold = 0.05,
  l2fc.threshold = 1,
  legend.pos = "top"
)
Arguments
| deobj | Object created by DESeq2 or edgeR. |
|---|---|
| deres | Data frame contains all genes/peaks. |
| group.key | Sample group information. When set NULL, select first column of metadata. Default: NULL. |
| ref.group | Reference group name. When set NULL, select first element of groups. Default: NULL. |
| base | A positive or complex number: the base with respect to which logarithms are computed. Default: 10. |
| fill.color | Color for box, |
| fill.alpha | Opacity of a geom. Default: 0.6. |
| gene.df | Gene data frame, at least contains Gene column. Default: NULL. When set NULL, use |
| label.key | Column name in |
| gene.num | Gene/Peak number to plot, choose according to log2FoldChange. When |
| plot.col | Column number of final plot. Default: 2. |
| scales | Scales same as |
| signif | Significance criterion. For DESeq2 results, can be chosen from padj, pvalue. For edgeR results, can be chosen from FDR, PValue. Default: padj. |
| signif.threshold | Significance threshold to get differentially expressed genes or accessible/binding peaks. Default: 0.05. |
| l2fc.threshold | Log2 fold change threshold to get differentially expressed genes or accessible/binding peaks. Default: 1. |
| legend.pos | Legend position. Default: top. |
Value
A ggplot2 object.
Examples
library(DESeq2) library(DEbPeak) count.file <- system.file("extdata", "snon_count.txt", package = "DEbPeak") meta.file <- system.file("extdata", "snon_meta.txt", package = "DEbPeak") count.matrix <- read.table(file = count.file, header = TRUE, sep = "\t") meta.info <- read.table(file = meta.file, header = TRUE) dds <- DESeq2::DESeqDataSetFromMatrix(countData = count.matrix, colData = meta.info, design = ~condition)#> Warning: some variables in design formula are characters, converting to factorskeep.genes <- rowSums(DESeq2::counts(dds, normalized = FALSE)) >= 10 dds <- dds[keep.genes, ] dds$condition <- relevel(dds$condition, ref = "WT") dds <- DESeq(dds)#>#>#>#>#>#>dds.results <- results(dds, contrast = c("condition", "KO", "WT")) dds.results.ordered <- dds.results[order(dds.results$log2FoldChange, decreasing = TRUE), ] GenePlot(deobj = dds, deres = dds.results.ordered, group.key = "condition", ref.group = "WT", fill.color = c("red", "blue"), fill.alpha = 0.8, gene.num = 2, signif = "pvalue", l2fc.threshold = 0.3)#>