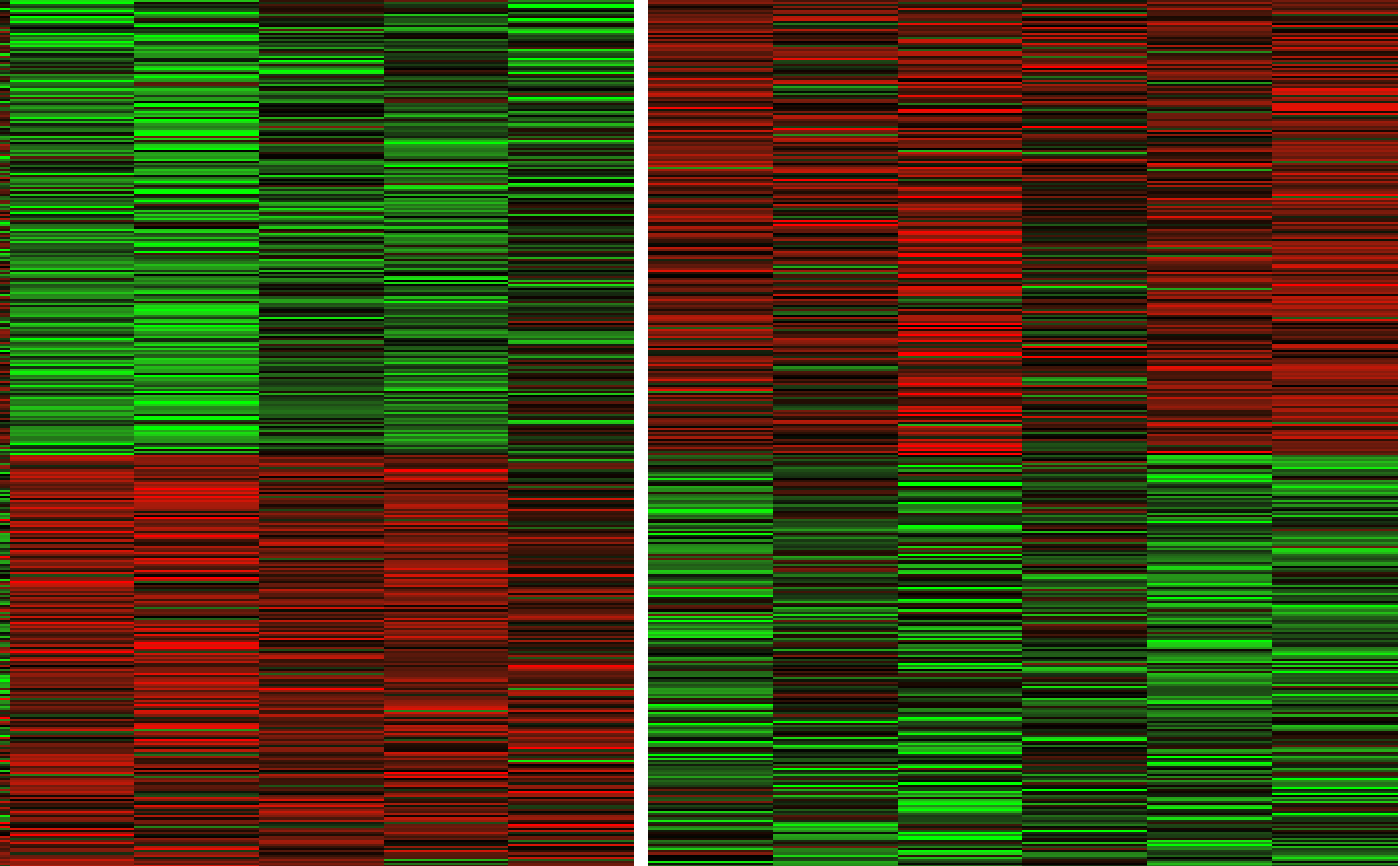
Heatmap for Differential Analysis Results.
DEHeatmap.RdHeatmap for Differential Analysis Results.
DEHeatmap(
  deobj,
  deres,
  group.key = NULL,
  ref.group = NULL,
  group.color = c("blue", "red"),
  gene.df = NULL,
  label.key = NULL,
  signif = "padj",
  signif.threshold = 0.05,
  l2fc.threshold = 1,
  exp.range = c(-2, 2),
  exp.color = c("green", "black", "red"),
  heatmap.height = 20,
  heatmap.width = 20,
  col.gap = 2,
  legend.height = 5,
  link.height = 4
)
Arguments
| deobj | Object created by DESeq2 or edgeR. |
|---|---|
| deres | Data frame contains all genes/peaks. |
| group.key | Sample group information. When set NULL, select first column of metadata. Default: NULL. |
| ref.group | Reference group name. When set NULL, select first element of groups. Default: NULL. |
| group.color | Color for different sample group. Default: blue for |
| gene.df | Gene data frame, at least contains Gene column. Default: NULL. When provided,
the second column should not be in |
| label.key | Which column to use as label. Default: NULL. When set NULL, use rownames of |
| signif | Significance criterion. For DESeq2 results, can be chosen from padj, pvalue. For edgeR results, can be chosen from FDR, PValue. Default: padj. |
| signif.threshold | Significance threshold to get differentially expressed genes or accessible/binding peaks. Default: 0.05. |
| l2fc.threshold | Log2 fold change threshold to get differentially expressed genes or accessible/binding peaks. Default: 1. |
| exp.range | Z-score range to plot. Default: c(-2,2). |
| exp.color | Color map used for heatmap. Default: c("green","black","red"). |
| heatmap.height | The height of whole heatmap. Default: 20cm. |
| heatmap.width | The width of whole heatmap. Default: 20cm. |
| col.gap | Gap between column slices. Default: 2mm. |
| legend.height | The height of legend. Default: 5cm. |
| link.height | The height of the segments. Default: 4mm. |
Value
A Heatmap-class.
Examples
library(DESeq2) library(DEbPeak) count.file <- system.file("extdata", "snon_count.txt", package = "DEbPeak") meta.file <- system.file("extdata", "snon_meta.txt", package = "DEbPeak") count.matrix <- read.table(file = count.file, header = TRUE, sep = "\t") meta.info <- read.table(file = meta.file, header = TRUE) dds <- DESeq2::DESeqDataSetFromMatrix(countData = count.matrix, colData = meta.info, design = ~condition)#> Warning: some variables in design formula are characters, converting to factorskeep.genes <- rowSums(DESeq2::counts(dds, normalized = FALSE)) >= 10 dds <- dds[keep.genes, ] dds$condition <- relevel(dds$condition, ref = "WT") dds <- DESeq(dds)#>#>#>#>#>#>dds.results <- results(dds, contrast = c("condition", "KO", "WT")) dds.results.ordered <- dds.results[order(dds.results$log2FoldChange, decreasing = TRUE), ] DEHeatmap(deobj = dds, deres = dds.results.ordered, group.key = "condition", ref.group = "WT", signif = "pvalue", l2fc.threshold = 0.3)#>