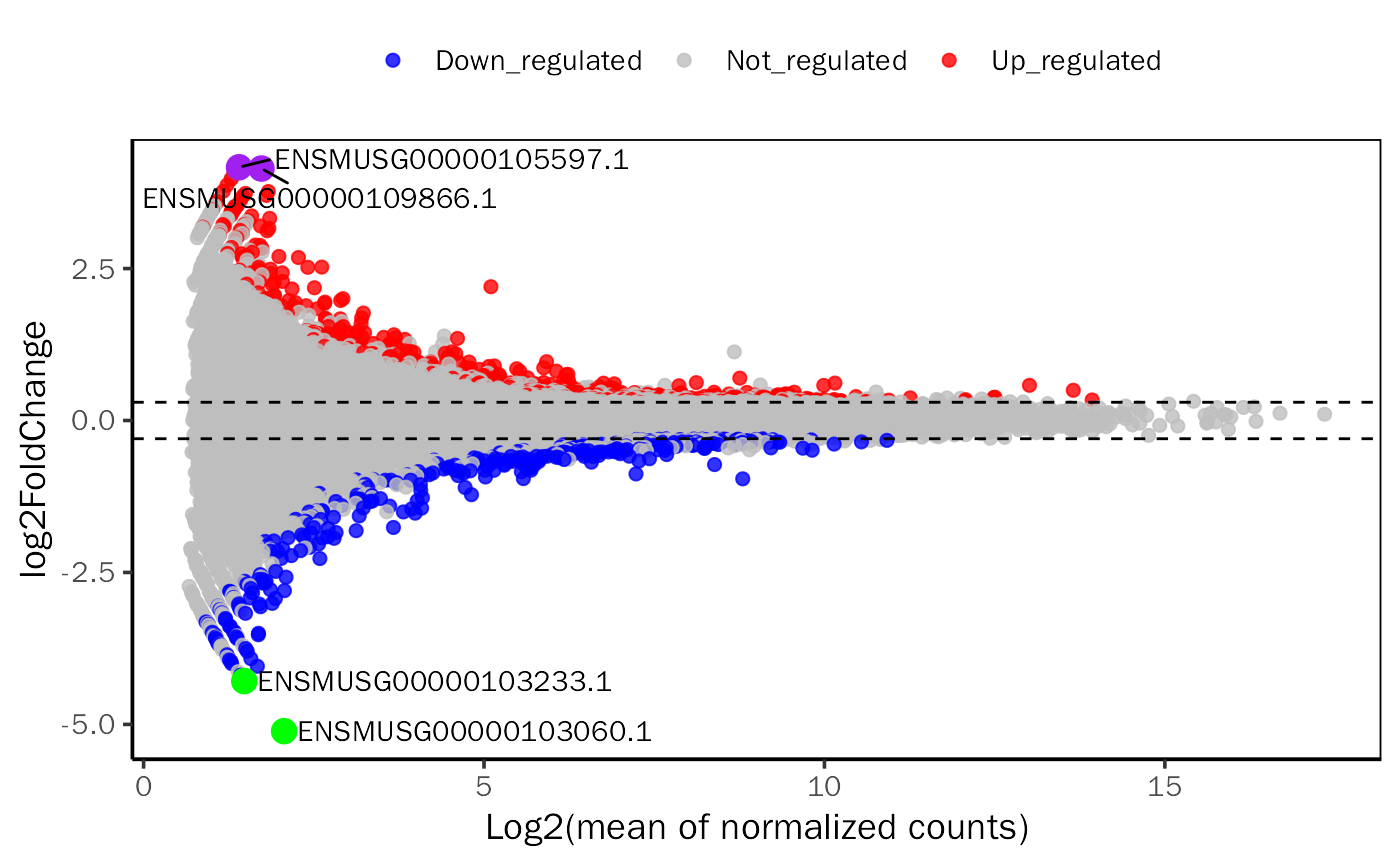
MA-plot for Differential Analysis Results.
MAPlot.RdMA-plot for Differential Analysis Results.
MAPlot(
  deres,
  signif = "padj",
  signif.threshold = 0.05,
  l2fc.threshold = 1,
  point.alpha = 0.6,
  point.size.vec = c(2, 4),
  linetype = 2,
  point.color.vec = c("blue", "grey", "red"),
  legend.pos = "top",
  label.num = NULL,
  label.df = NULL,
  label.key = NULL,
  label.color = NULL
)
Arguments
| deres | Data frame contains all genes/peaks. |
|---|---|
| signif | Significance criterion. For DESeq2 results, can be chosen from padj, pvalue. For edgeR results, can be chosen from FDR, PValue. Default: padj. |
| signif.threshold | Significance threshold to get differentially expressed genes or accessible/binding peaks. Default: 0.05. |
| l2fc.threshold | Log2 fold change threshold to get differentially expressed genes or accessible/binding peaks. Default: 1. |
| point.alpha | Opacity of a geom. Default: 0.6. |
| point.size.vec | Point size for regular (all points) and(or) labeled points. Default: 2 for regular and 4 for labeled points. |
| linetype | Threshold linetype. Default: 2. |
| point.color.vec | Point color for Down, Not, Up regulated genes or peaks. Default: red for Up, grey for Not and blue for Down. |
| legend.pos | Legend position. Default: top. |
| label.num | Gene/Peak number to label, choose according to log2FoldChange. When |
| label.df | Label data frame, at least contains Gene column. Default: NULL(use |
| label.key | Which column to use as label. Default: NULL (use rownames of |
| label.color | Color vector for labels. Default: NULL. |
Value
A ggplot2 object.
Examples
library(DESeq2) library(DEbPeak) count.file <- system.file("extdata", "snon_count.txt", package = "DEbPeak") meta.file <- system.file("extdata", "snon_meta.txt", package = "DEbPeak") count.matrix <- read.table(file = count.file, header = TRUE, sep = "\t") meta.info <- read.table(file = meta.file, header = TRUE) dds <- DESeq2::DESeqDataSetFromMatrix(countData = count.matrix, colData = meta.info, design = ~condition)#> Warning: some variables in design formula are characters, converting to factorskeep.genes <- rowSums(DESeq2::counts(dds, normalized = FALSE)) >= 10 dds <- dds[keep.genes, ] dds$condition <- relevel(dds$condition, ref = "WT") dds <- DESeq(dds)#>#>#>#>#>#>dds.results <- results(dds, contrast = c("condition", "KO", "WT")) dds.results.ordered <- dds.results[order(dds.results$log2FoldChange, decreasing = TRUE), ] MAPlot(dds.results.ordered, signif = "pvalue", l2fc.threshold = 0.3, label.num = 2, point.alpha = 0.8, label.color = c("purple", "green"))#>