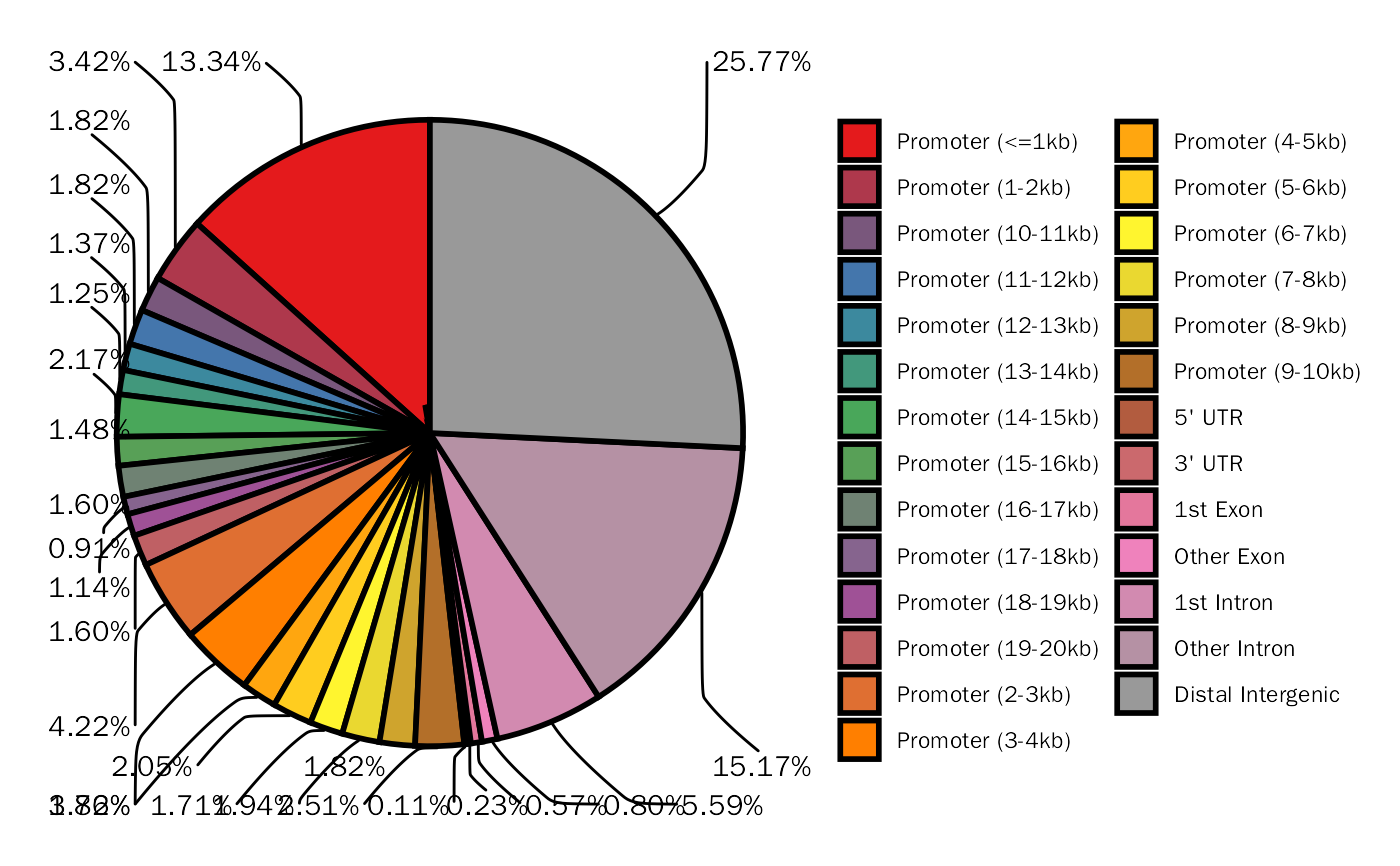
Create Peak Annotation Pie Plot with ggplot2.
PeakAnnoPie.RdCreate Peak Annotation Pie Plot with ggplot2.
PeakAnnoPie(peak.obj, ...)
Arguments
| peak.obj | Peak annotation object, returned from |
|---|---|
| ... | Parameters for |
Value
A ggplot2 object.
Examples
library(DEbPeak) peak.file <- system.file("extdata", "debchip_peaks.bed", package = "DEbPeak") peak.df <- GetConsensusPeak(peak.file = peak.file) peak.anno <- AnnoPeak( peak.df = peak.df, species = "Mouse", seq.style = "UCSC", up.dist = 20000, down.dist = 20000 )#> >> preparing features information... 2023-07-02 17时21分42秒 #> >> identifying nearest features... 2023-07-02 17时21分42秒 #> >> calculating distance from peak to TSS... 2023-07-02 17时21分42秒 #> >> assigning genomic annotation... 2023-07-02 17时21分42秒 #> >> adding gene annotation... 2023-07-02 17时21分44秒#>#> >> assigning chromosome lengths 2023-07-02 17时21分44秒 #> >> done... 2023-07-02 17时21分44秒#> Warning: Removed 6 rows containing non-finite values (`stat_count()`).PeakAnnoPie(peak.anno$anno.obj)