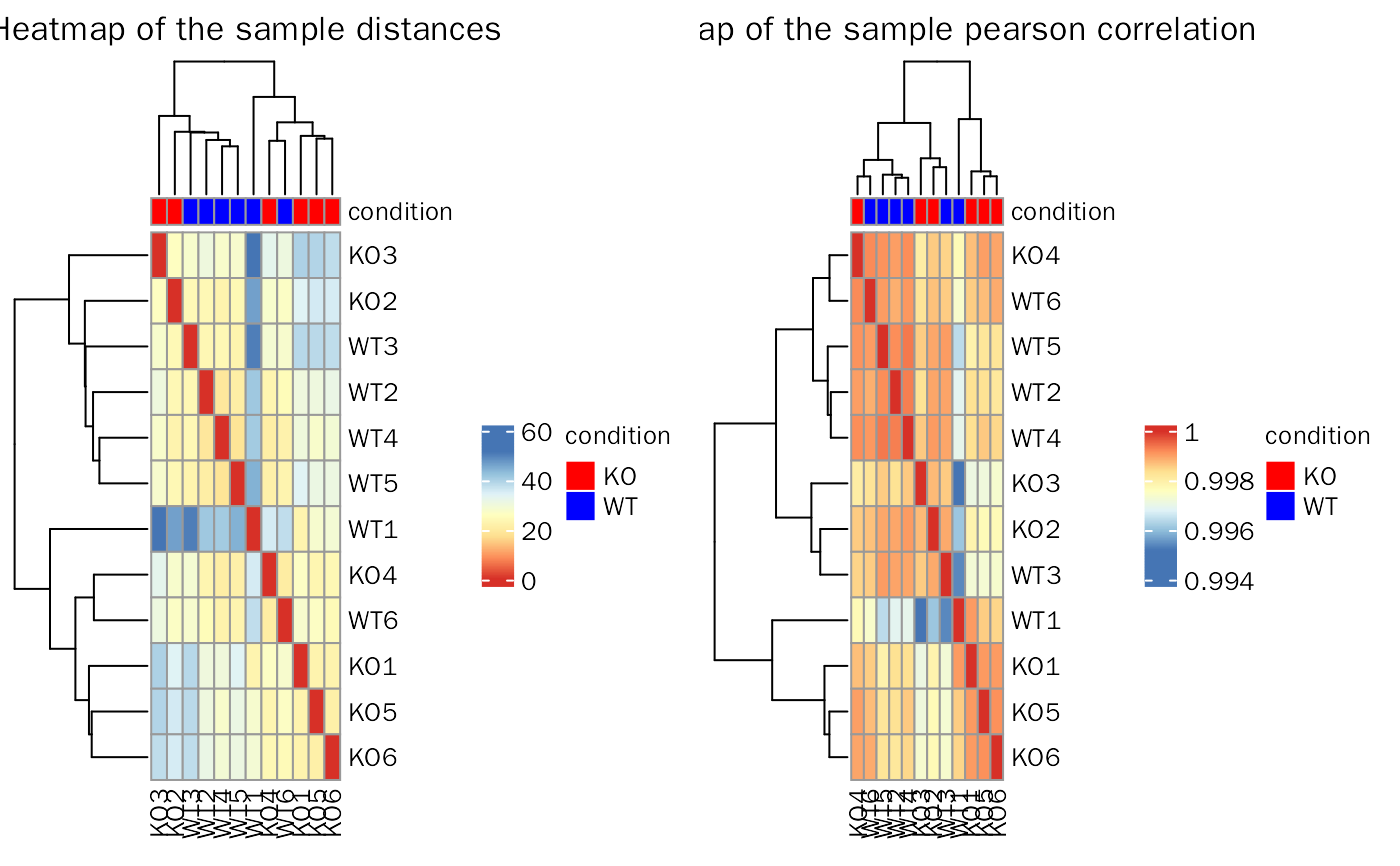
Sample to sample relationship.
SampleRelation.RdSample to sample relationship.
SampleRelation(
  deobj,
  gene = NULL,
  remove.sample = NULL,
  transform.method = c("rlog", "vst", "ntd"),
  anno.key = NULL,
  ...
)
Arguments
| deobj | Object created by DESeq2 or edgeR. |
|---|---|
| gene | Genes used to create sample relationship. Default: NULL. |
| remove.sample | Sample(s) to remove. Default: NULL. |
| transform.method | Data transformation methods, chosen from rlog, vst and ntd. Default: rlog. |
| anno.key | Group to annotate samples. When set NULL, select first column of metadata. Default: NULL. |
| ... | Parameters for |
Value
Plot of sample distances and sample pearson correlation.
Examples
library(DESeq2) library(DEbPeak) count.file <- system.file("extdata", "snon_count.txt", package = "DEbPeak") meta.file <- system.file("extdata", "snon_meta.txt", package = "DEbPeak") count.matrix <- read.table(file = count.file, header = TRUE, sep = "\t") meta.info <- read.table(file = meta.file, header = TRUE) dds <- DESeq2::DESeqDataSetFromMatrix(countData = count.matrix, colData = meta.info, design = ~condition)#> Warning: some variables in design formula are characters, converting to factorskeep.genes <- rowSums(DESeq2::counts(dds, normalized = FALSE)) >= 10 dds <- dds[keep.genes, ] SampleRelation(deobj = dds, transform.method = "rlog", anno.key = "condition")#>