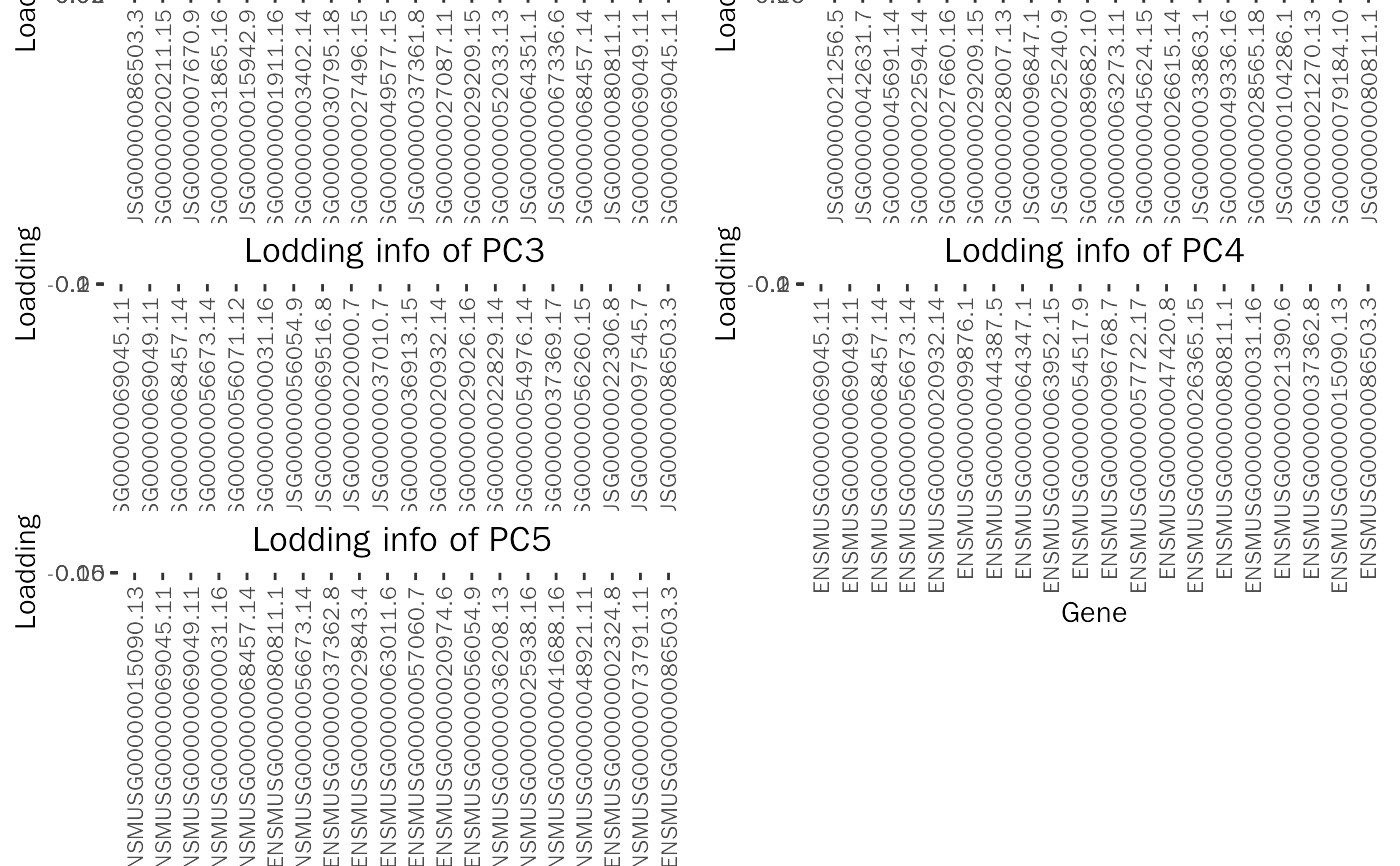
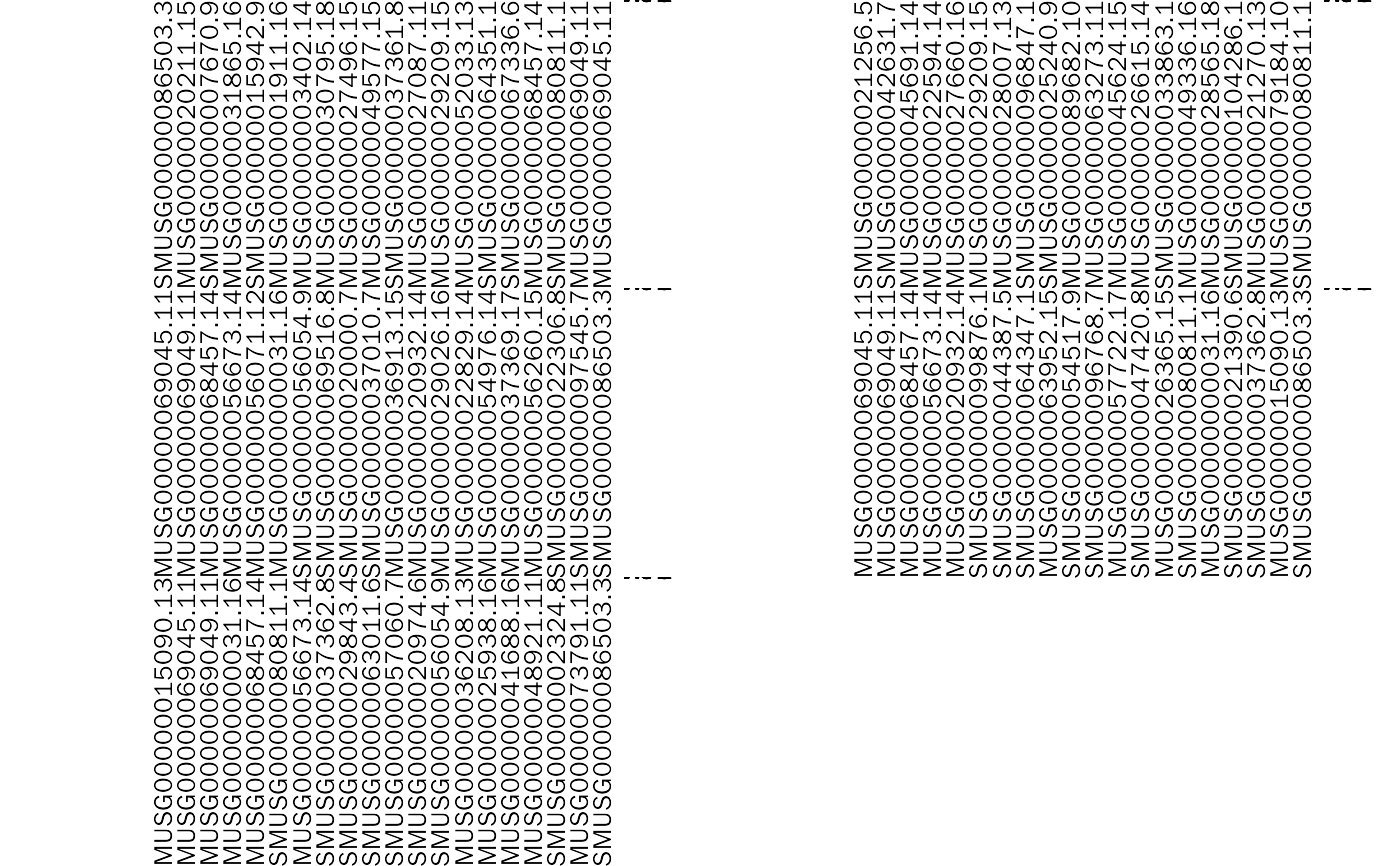
PCA loading plot.
LoadingPlot.RdPCA loading plot.
LoadingPlot(
  pca,
  deobj = NULL,
  type = c("bar", "heat"),
  data.type = c("RNA", "ChIP", "ATAC"),
  peak.anno.key = c("Promoter", "5' UTR", "3' UTR", "Exon", "Intron", "Downstream",
    "Distal Intergenic", "All"),
  pc = 1:5,
  gene.num = 10,
  ncol = 2
)
Arguments
| pca | PCA results of |
|---|---|
| deobj | Object created by DESeq2 or edgeR. |
| type | loading plot type, chosen from bar, heat. Default: bar. |
| data.type | Input data type, choose from RNA, ChIP, ATAC. Default: RNA. |
| peak.anno.key | Peak location, chosen from "Promoter", "5' UTR", "3' UTR", "Exon", "Intron", "Downstream", "Distal Intergenic","All". Default: "Promoter". |
| pc | Specify PC to export genes. Default: 1:5. |
| gene.num | Gene number to export for every PC. Default: 10. |
| ncol | Column of final plots. Default: 2. |
Value
Loading plot.
Examples
library(DESeq2) library(DEbPeak) count.file <- system.file("extdata", "snon_count.txt", package = "DEbPeak") meta.file <- system.file("extdata", "snon_meta.txt", package = "DEbPeak") count.matrix <- read.table(file = count.file, header = TRUE, sep = "\t") meta.info <- read.table(file = meta.file, header = TRUE) dds <- DESeq2::DESeqDataSetFromMatrix(countData = count.matrix, colData = meta.info, design = ~condition)#> Warning: some variables in design formula are characters, converting to factorskeep.genes <- rowSums(DESeq2::counts(dds, normalized = FALSE)) >= 10 dds <- dds[keep.genes, ] pca_res <- PCA(deobj = dds, transform.method = "rlog")#>#>LoadingPlot(pca = pca_res, type = "bar")#>#>LoadingPlot(pca = pca_res, deobj = dds, type = "heat")#>#>#>